Key Takeaways $78K stopped the initial surge. $73,230 is the line in the sand. $69K–$70.3K anchors the wider recovery. A close above $77.4K reopens $82.8K. The chart dictates reality. The bre
Key Takeaways
- $78K stopped the initial surge.
- $73,230 is the line in the sand.
- $69K–$70.3K anchors the wider recovery.
- A close above $77.4K reopens $82.8K.
- The chart dictates reality.
The breakout finally met its match
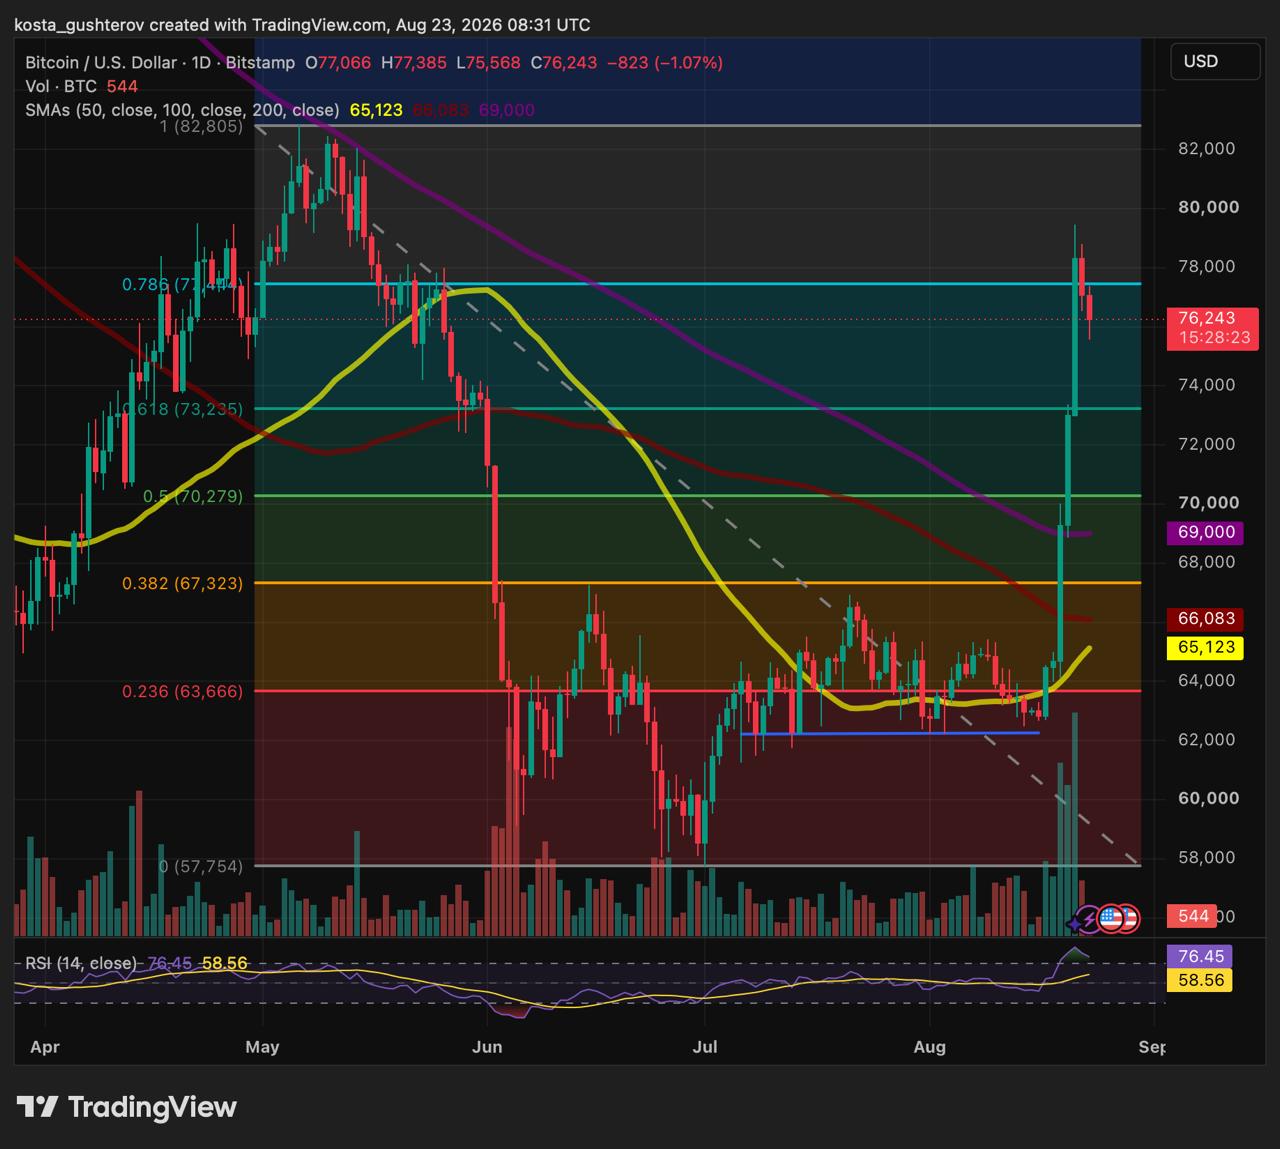
Bitcoin didn’t grind its way up; it tore through the $63,600, $67,300, and $70,280 Fibonacci levels in a matter of days, shattering a descending trendline that had capped the chart since May.
That momentum carried BTC directly into the $77,40 Fibonacci resistance zone, where the advance finally stalled. The August 23 daily chart shows Bitcoin trading near $76,200 after tagging $77,400 during the session, with an intraday low dipping to $75,500.
Bitcoin rally pausing near $78,000.
A single red daily candle isn’t a crisis. After such a violent upward push, the real question is whether Bitcoin can establish a floor on the ground it just reclaimed. While breakout volume dwarfed anything seen during the August consolidation, the move still needs a solid structural base underneath it.
$73,230 is where the pullback gets judged
The first serious test sits at $73,230 – the 0.618 Fibonacci retracement. Bitcoin sliced right through it on the way up; now, buyers have to prove that old ceiling has flipped into a reliable floor.
A dip into that area followed by a firm daily close back above it keeps the bullish structure healthy. It would signal a cooling market, not a broken one. A decisive daily breakdown, however, shifts the spotlight squarely toward the $69,000–$70,280 band.
That lower zone carries vastly more weight. The 0.5 Fibonacci level sits at $70,280, backed closely by the 200-day moving average near $69,000. Bitcoin has room to give back a fraction of its recent gains without doing lasting damage, but it cannot afford to bleed through every single level it just fought to reclaim.
The moving averages are finally underneath
For months, Bitcoin traded trapped beneath its key daily moving averages. Now, it sits comfortably above all three: the 50-day near $65,120, the 100-day around $66,083, and the 200-day at $69,000.
That macro shift gives the recovery far more substance than a fleeting short squeeze. It also explains why the $69K-$70.3K region is so critical – a drop there tests the very backbone of the breakout rather than just shaking out weak leverage.
Drop below that band, and the $67,300 retracement becomes the next line of defense. Hold above it, and the market has all the room it needs to consolidate and reload for another push.
Cosmo Jiang, portfolio manager at Pantera Capital, noted that traders and funds are aggressively shifting off the sidelines and unwinding net-short positions now that Bitcoin has cleared its 200-day moving average, pointing to $80,000 as the next major hurdle.
The daily chart forces a reality check on that optimism. Bitcoin doesn’t need to touch $80,000 today to validate Jiang’s thesis; it simply needs to defend $73,235. Fail to hold that line, and the breakout risks devolving into a frantic liquidity grab that simply slammed into the exact same supply wall near $78K.
Standard Chartered’s Geoff Kendrick has also dialed up his bullish stance, suggesting his year-end target may need an upward revision toward a staggering $126,000 record. While it highlights how fast sentiment can flip, a headline price target is no substitute for a daily close holding key support.
What the market demands next
Bitcoin has already cleared the hardest hurdle: escaping the summer range, reclaiming structural moving averages, and forcing the broader market back to attention. Now comes the gritty part, maintaining those gains while profit-takers step in.
A daily close past $77,400 puts the $82,800 swing high squarely back in play. As long as the $73,230 level holds, the bullish blueprint remains intact. Lose the $69K-$70,300 shelf, and the bulls will have a much steeper climb to prove this breakout is built to last.
The conclusion for now could be that Bitcoin didn’t fail at $78K; it is being tested there. The verdict might not come from bullish price targets overhead, but from buyers holding the line below.
This article is provided for informational purposes only and does not constitute investment advice.
The post Bitcoin Hits a Wall at $78,000 – Which Levels Matter Now appeared first on Coindoo.