Key Takeaways Bitcoin remains above its nearest daily support. Long-held coins are moving more frequently. Spot-demand growth turned negative for two days. Futures-demand growth remained posi
Key Takeaways
- Bitcoin remains above its nearest daily support.
- Long-held coins are moving more frequently.
- Spot-demand growth turned negative for two days.
- Futures-demand growth remained positive during consolidation.
Bitcoin is holding, but $80,000 remains unfinished business
Bitcoin traded near $77,800 around 13:30 UTC on September 1 after reaching an intraday high of $79,180. The price remained below the recent resistance area between $80,000 and $81,000, where several attempts to extend the recovery have stalled.
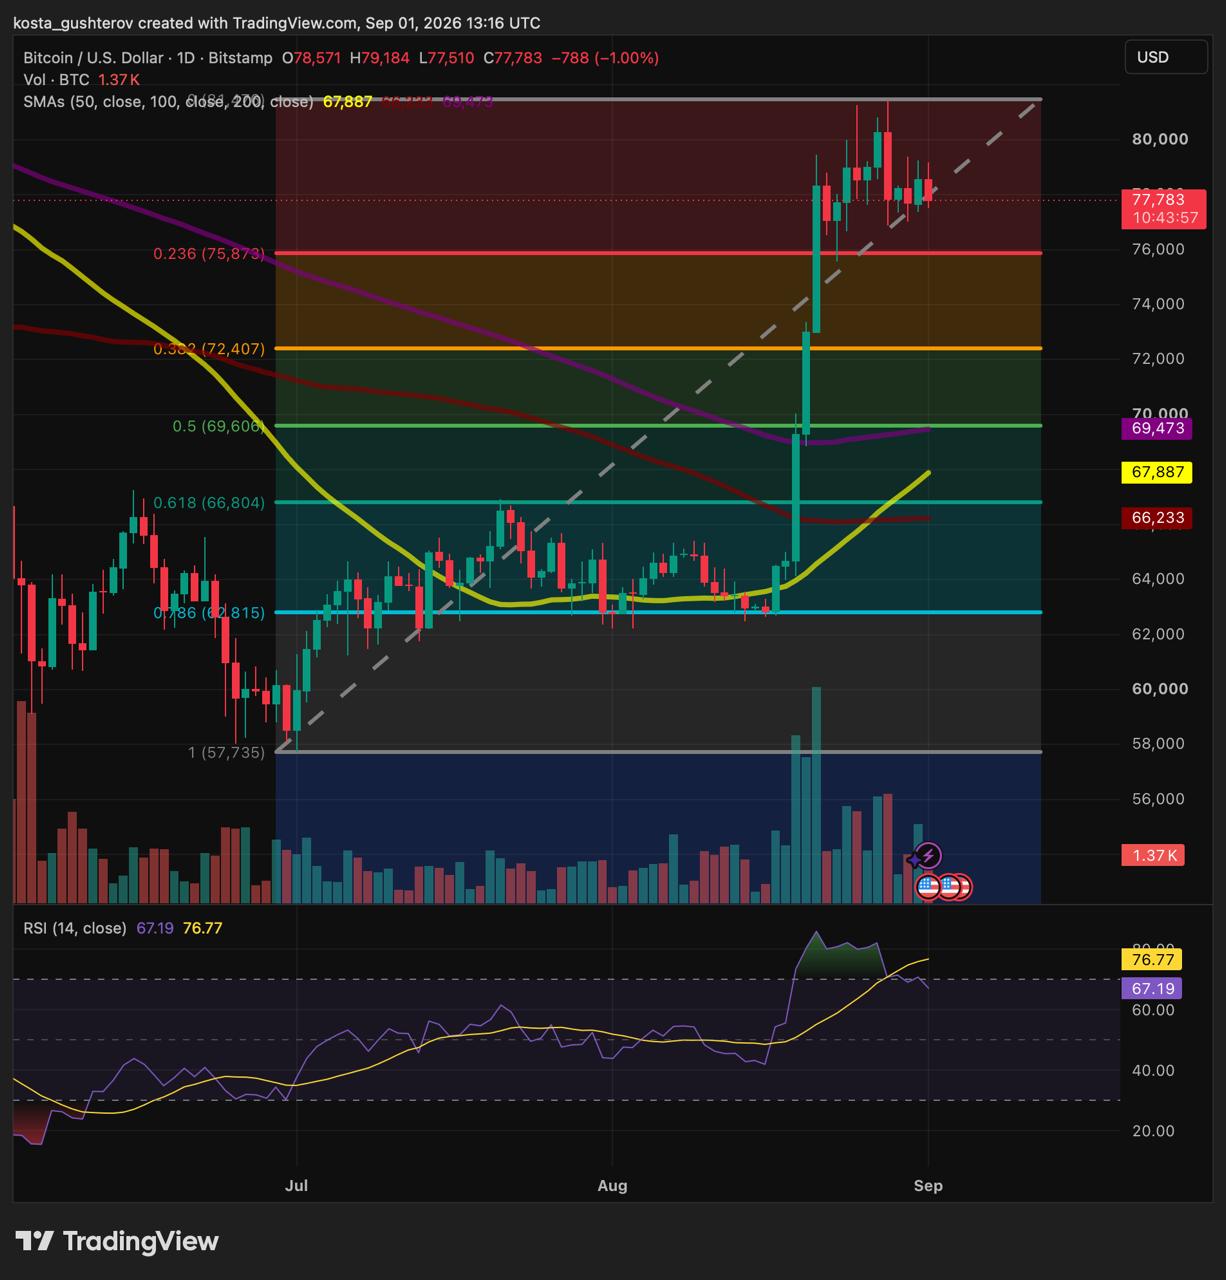
Bitcoin daily price chart with Fibonacci levels.
The daily chart placed the nearest support at approximately $75,870, the 0.236 Fibonacci retracement of the advance from $57,750. Bitcoin was also trading above its 50-, 100- and 200-day simple moving averages, which were positioned between roughly $66,200 and $69,500.
Daily RSI had cooled to 67.19 after moving above 70 during the rally. Momentum has lost some heat, but the chart has not suffered technical damage. Bitcoin is consolidating above support without yet recovering its recent highs.
Older coins became more active during the rally
The 30-day sum of long-term-holder distribution rose from 174,500 BTC to 281,900 BTC between August 18 and August 28, an increase of 61.5%, according to CryptoQuant. The August 28 reading was the metric’s highest since the beginning of 2026.
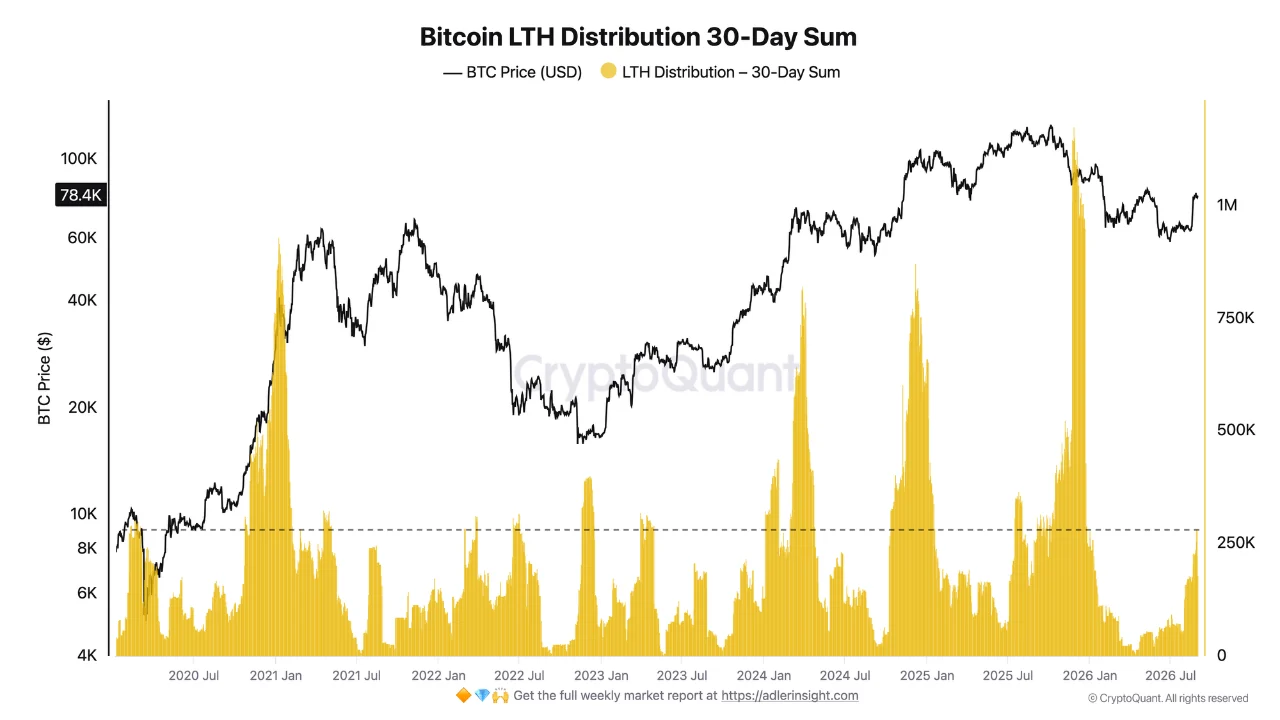
Bitcoin Long-Term Holder Distribution 30-Day Sum.
The figure measures activity among coins held for longer periods; it does not show 281,900 BTC arriving on exchanges or being sold. Some of those movements may reflect profit realization, custody changes or other transfers.
Bitcoin’s rise from approximately $64,000 toward $80,000 created a more attractive window for holders sitting on accumulated gains. The increase in distribution suggests that some took advantage of that window. Price remaining near $78,000 indicates that available demand has so far kept pace with those flows, but the next attempt at resistance will require that balance to continue.
Gate deposits raise the possibility of profit-taking
Retail-sized Bitcoin deposits to Gate increased shortly after the rally. Between August 23 and August 30, CryptoQuant recorded more than 11 notable spikes, with hourly deposits reaching $11.33 million on August 29, their highest level of 2026.
![A CryptoQuant chart titled "[BTC] - Gate Retail to Exchange Flow" tracking exchange inflows across various transaction size brackets alongside the Bitcoin price in USD from late 2025 to August 2026.](https://coindoo.com/wp-content/uploads/2026/09/laPCZFW_4ade16ab9a5ca400aa560adf3c6692e22209f53fe4253aa66145fc2399c8b36f.webp)
Bitcoin retail-to-exchange inflow metrics. Deposited Bitcoin can be sold, posted as collateral or exchanged for another asset, so the flow cannot be converted directly into selling pressure. What changed was the location of the coins: more BTC moved onto an exchange after a strong price advance, making profit-taking easier if those holders chose to act.
That caution is not limited to Gate. Coindoo recently found that Binance reserves were rising while short-term holders realized modest profits. The newer readings bring long-term holders into the same supply-side discussion just as growth in spot demand has weakened.
Spot and futures demand growth are moving apart
CryptoQuant’s 30-day demand-growth measure fell below zero for spot trading during two consecutive sessions. Over the same period, perpetual-futures demand growth remained positive and increased during the latest reading.
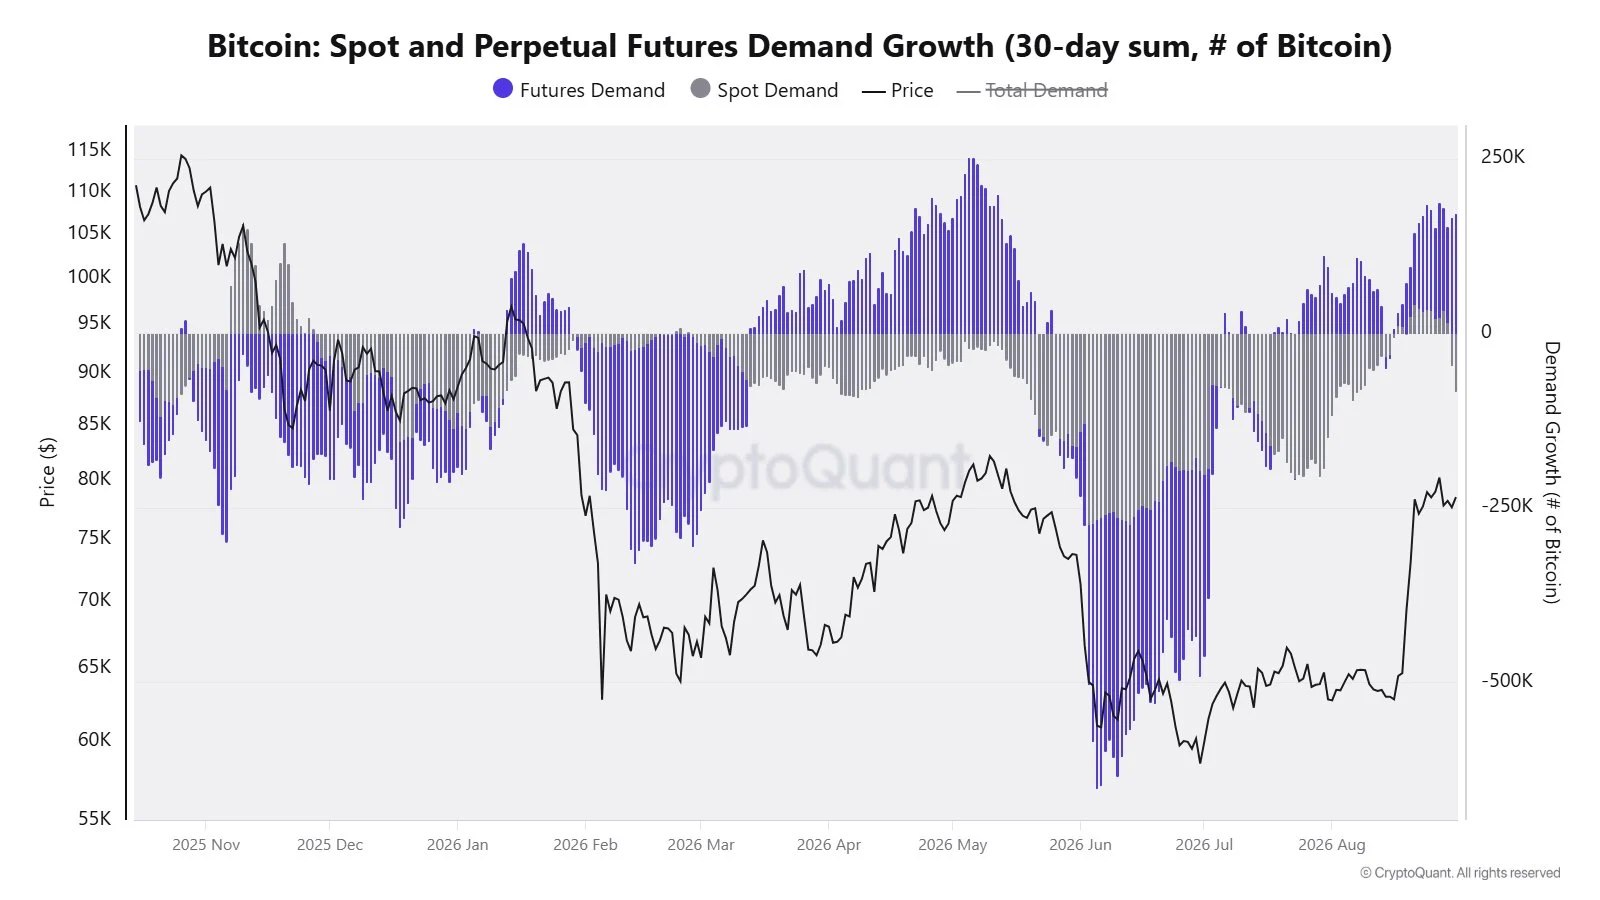
Bitcoin spot and perpetual futures demand growth.
The result points to stronger growth in derivatives positioning than in direct coin purchases. Futures allow traders to gain Bitcoin exposure without taking delivery of the asset, often with leverage. Those positions can expand quickly during a rally, but they can also unwind faster when price moves against them.
That makes renewed spot participation important for the quality of any breakout. Direct buyers must take ownership of the Bitcoin offered to the market, providing a more durable counterweight when older holders or exchange users make additional coins available.
The sample remains short and overlaps with the end of August, when lower liquidity may have affected the spot reading. Two negative sessions cannot establish a lasting demand shift. The concern would become more meaningful if spot-demand growth stayed below zero while holder distribution remained elevated.
The next breakout needs spot confirmation
The latest readings leave Bitcoin with three identifiable outcomes:
- Above $80,000-$81,000: A daily close through recent resistance would carry more weight if spot-demand growth also returned above zero.
- Between $75,870 and $80,000: Bitcoin would remain in consolidation while the market waits for a clearer balance between available supply and direct demand.
- Below $75,870: A confirmed daily breakdown would weaken the recovery and expose the next Fibonacci support near $72,400.
Bitcoin has preserved its structure despite heavier activity from older coins. That is the constructive part of the current setup. The unresolved question is who finances the next leg: buyers taking ownership of Bitcoin or traders adding leveraged exposure.
A breakout accompanied by positive spot-demand growth would answer that question far more convincingly than another increase in futures activity alone.
This article is for informational purposes only and does not constitute financial or investment advice.
The post Bitcoin Holds $78K as Old Coins Test Spot Demand appeared first on Coindoo.