Bitcoin is trading near $85,376, and traders are asking one thing. Is another run at $100,000 coming? The price has moved inside a tight box for two weeks. On-chain data and whale buying hint
Bitcoin is trading near $85,376, and traders are asking one thing. Is another run at $100,000 coming?
The price has moved inside a tight box for two weeks. On-chain data and whale buying hint at a move higher, but the macro picture is not simple.
Why Is BTC Falling Today?
Bitcoin slipped below $85,000 as the U.S. 20-year Treasury yield jumped to 5.735%. That is its highest level in 24 years.
Higher yields often pull money out of risky assets. Crypto usually feels that pressure first.
ETF flows are soft too. According to SoSoValue, U.S. spot BTC ETFs saw a net outflow of $89.90 million on October 5. BlackRock's IBIT was the only fund with net inflows.
What Is the Current BTC Price Range?
Over the past two weeks, The coin has moved between $83,000 and $86,700. It has not broken out of that range yet.
The 4-hour chart shows several levels that matter right now.
Level
Price
Why It Matters
Range top
$86,700
Breakout point
Minor resistance
$85,800
Recent rejection area
Current price
$85,376
4-hour chart reading
Minor support
$84,800
Mid-range floor
Minor support
$83,900
Lower range zone
Range bottom
$83,000
Last line before a breakdown
Other charts show $85,582 and $85,031 as the current price. They were likely captured at different times, so this article uses $85,376.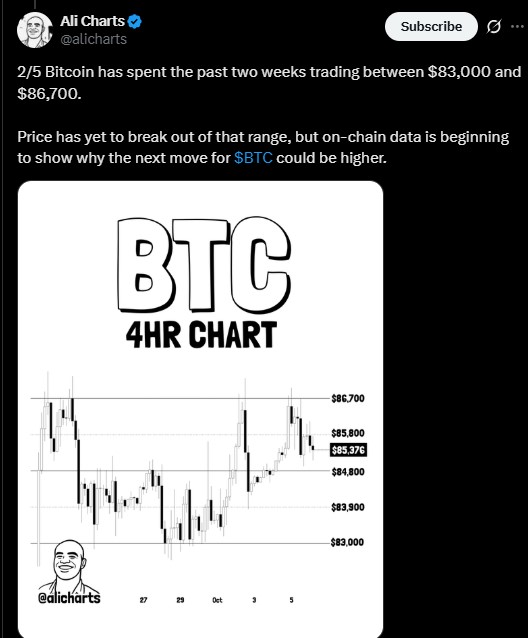
Where Is BTC Support and Resistance?
The strongest floor sits between $83,300 and $84,600. URPD data shows 1.59 million Coins were traded in this zone.
That many coins changing hands gives buyers a clear level to defend. Holders near break-even often step in to protect their cost.
The URPD chart also shows trading activity far below, with the low end near $76,996. Above $86,700, there is no comparable supply cluster until about $105,000. The top bar on the chart sits at $104,765.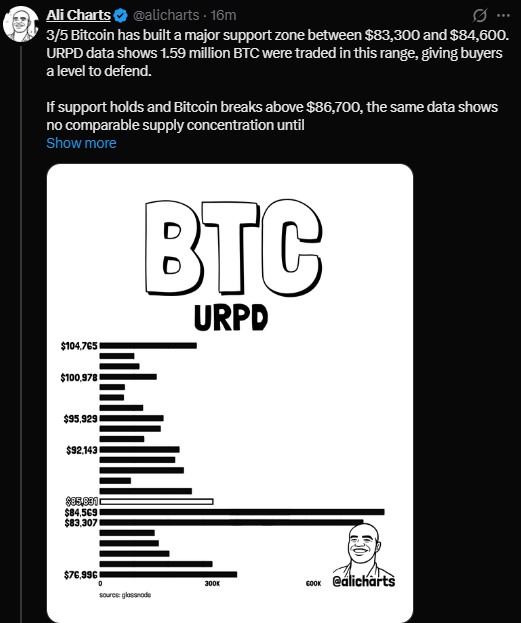
In simple terms, fewer trapped sellers are waiting overhead.
Are Whales Buying BTC Right Now?
It looks that way. Since October 1, large holders have added more than 14,335 BTC, worth about $1.22 billion.
Santiment data shows whale holdings rising from around 5.23 million BTC toward 5.25 million BTC. There was a small dip in the latest reading, so the trend is not perfectly smooth.
Whale buying does not promise a rally. It does show that big wallets are not rushing to sell at this range.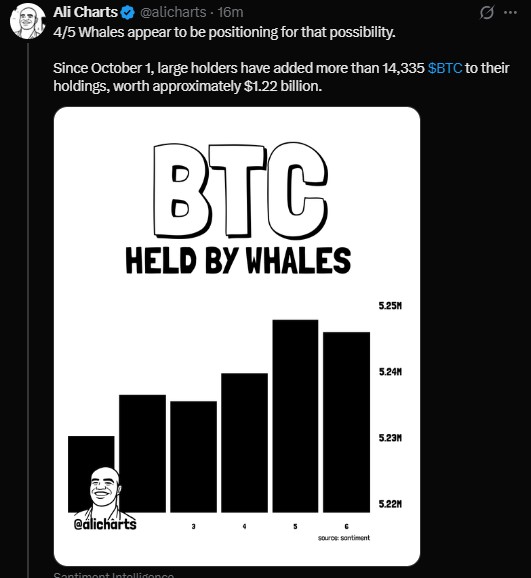
Could Leverage Trigger a Bigger Drop?
This is the risk side of the story. The Coinglass 30-day liquidation map, which tracks Binance, OKX, and Bybit, shows a market heavy with long positions. It lists the current price at $85,582.
A 10% drop in Bitcoin could wipe out more than $13 billion in longs. A 10% rise would liquidate less than $4 billion in shorts.
That gap matters. If price breaks $83,000, forced selling could speed up the fall and raise volatility.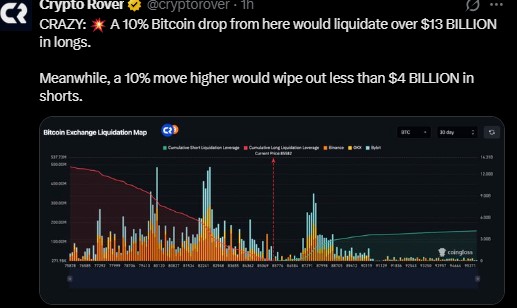
Is the 4chan Bitcoin Cycle Prediction Real?
Today, October 6, is exactly 365 days since BTC hit its all-time high. An old 4chan post from 2023 predicted that this cycle's peak would land on October 6, 2025.
The post used past cycle gaps of 1,064 days and 364 days. By that pattern, today would mark the cycle bottom.
Crypto Rover points out that the coin already bottomed in July. His take is that the cycle is broken. Patterns like this are fun to watch, but they are not a trading plan.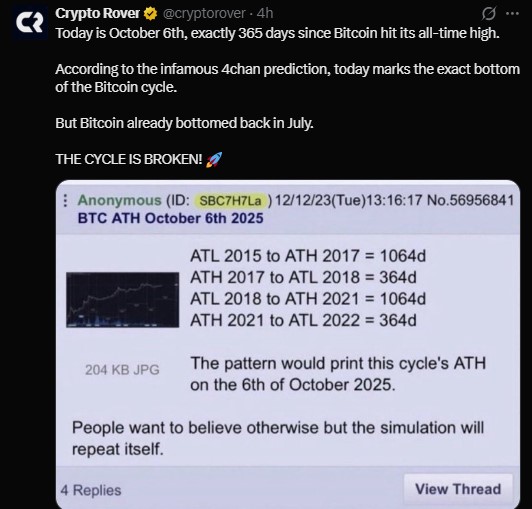
Will BTC Hit $100,000 Again?
The setup comes down to two levels. Support is $83,300 to $84,600, and the breakout point is $86,700.
If buyers defend support and clear the top of the range, $100,000 could come back into focus. Some traders say that once the asset breaks its triangle pattern, $100K comes fast. That is a bold claim, not a fact.
If support fails, the downside could be sharp because of the long-heavy leverage.
What Is the Bitcoin Price Prediction for Now?
Scenario
What Needs to Happen
Possible Outcome
Bullish
Support holds, price closes above $86,700
Move toward $100,000 to $105,000
Neutral
Price keeps moving between $83,000 and $86,700
More sideways trading
Bearish
Price breaks below $83,000
Long liquidations and a fast drop
None of these paths is certain. Yields, ETF flows, and whale activity will likely decide which one plays out.
Disclaimer
This article is for information only and is not financial, investment, or trading advice. Cryptocurrency prices are highly volatile, and you can lose some or all of your money. Past performance does not guarantee future results. Always do your own research and speak with a licensed financial advisor before making any decision.