Bitcoin has experienced six consecutive weeks of decline. However, several indicators suggest a possible local trough. K33, in particular, identifies an exceptional oversold situation. Glassn
Bitcoin has experienced six consecutive weeks of decline. However, several indicators suggest a possible local trough. K33, in particular, identifies an exceptional oversold situation. Glassnode, for its part, observes a capitulation of crypto investors. Yet, the weakness of demand still prevents confirming a true reversal of BTC’s price.
In brief
- Bitcoin has experienced six weeks of decline, with a weekly drop of 14%.
- Its RSI fell to 19.95 on November 14, signaling strong selling pressure.
- Glassnode identifies an accumulation zone between $62,000 and $66,000, with an additional 66,000 BTC.
- US spot Bitcoin ETFs recorded $239.9 million in net outflows on November 17.
- Despite these capitulation signals, a lasting return of buyers remains to be confirmed.
Six weeks of decline place bitcoin in oversold territory
The bitcoin price correction is starting to produce rarely seen signals. In its November 16 analysis, K33 indeed highlights that BTC lost 14% in one week, after six consecutive weeks of decline.
Vetle Lunde, head of research at K33, specifically identifies several indicators characteristic of previous market lows.
- The daily RSI, which measures the speed and amplitude of price changes, notably dropped to 19.95. A level below 30 generally indicates an oversold situation.
- Bitcoin also fell below its 200-week moving average, located around $68,000.
Another important signal: 51.5% of bitcoins in circulation would now be held at a loss.
For Vetle Lunde, these conditions strengthen the hypothesis of a local trough. In his report, the crypto analyst even considers that any entry below $70,000 would be a “market gift”. This appraisal remains, however, his interpretation, not a confirmation of reversal.
Glassnode identifies a defense zone between $62,000 and $66,000
The onchain data published by Glassnode on November 17 shows that realized losses have reached levels comparable to those observed near previous market floors. The company identifies a significant concentration of bitcoin purchases between $62,000 and $66,000. Around 66,000 additional BTC joined this zone during the two days of most intense selling.
This accumulation shows that some crypto investors are indeed taking advantage of the bitcoin correction. However, it is not sufficient to demonstrate a generalized return of demand.
Bitcoin Level
Meaning
$74,100
Average cost for short-term holders
$68,000
200-week moving average
$62,000–$66,000
Recent buyer concentration zone
$58,500
June low
$53,700
Bitcoin realized price
A daily close below $62,000 would therefore weaken this defense zone. According to Glassnode, the next levels to watch are respectively at:
Capitulation signals do not guarantee a bitcoin rebound
The main obstacle remains the absence of sufficiently strong demand to sustainably absorb sales. US Bitcoin ETF data illustrates this fragility. According to Farside Investors, these funds indeed recorded $239.9 million in net outflows on November 17 (after a slightly positive day the day before). BlackRock even recorded 11 sessions in the red.
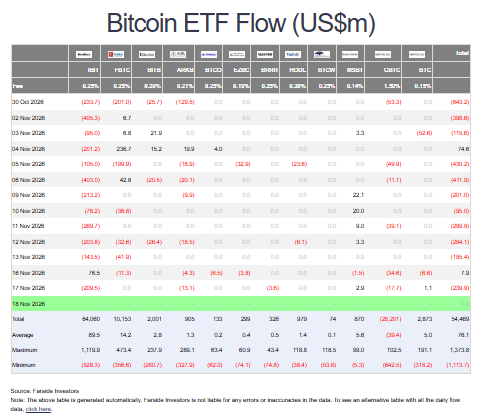
Flows of US Bitcoin ETFs. Source: Farside Investors
Derivative markets also show strong caution. K33 observes a rise in demand for downside protection on Bitcoin options. The one-month 25-delta skew exceeded 20, a level rarely seen since July.
These indicators reflect an ambivalent situation. Sales could lose intensity, but crypto investors continue to protect themselves against a new correction.
Bitcoin thus evolves in a zone where capitulation signals multiply, without the buyers yet demonstrating their ability to sustainably regain control. The formation of a local trough remains plausible. However, its confirmation will depend on the return of spot demand, stabilization of ETF flows, and the reclamation of technical resistances. Story to watch closely…