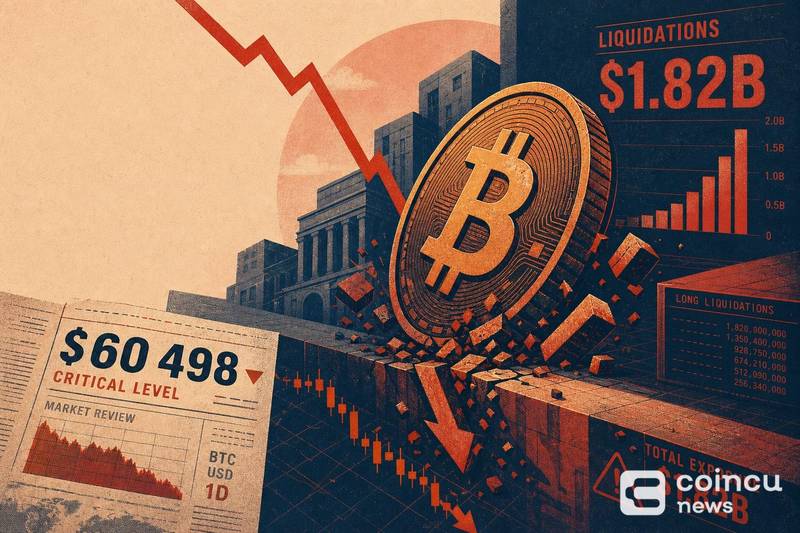
Bitcoin long liquidations on major centralized exchanges could reach $1.82 billion if BTC falls below $60,498, according to liquidation heatmap data, highlighting concentrated leverage risk a
Bitcoin long liquidations on major centralized exchanges could reach $1.82 billion if BTC falls below $60,498, according to liquidation heatmap data, highlighting concentrated leverage risk at a single price band that traders are closely monitoring.
The estimate, derived from Coinglass liquidation map data, reflects the cumulative value of long positions across major CEXs that would face forced closure if Bitcoin's spot price breaches the $60,498 threshold. The figure represents a scenario, not a forecast, and depends on current open interest remaining unchanged as price approaches that level.
Why the $60,498 Level Concentrates Liquidation Risk
A long liquidation occurs when a trader holding a leveraged long position, essentially a bet that price will rise, sees the market move far enough against them that the exchange automatically closes the position to prevent further losses. The $60,498 level matters because liquidation map data shows an unusually dense cluster of long positions with margin requirements that would be exhausted at or near that price.
The $1.82 billion figure spans multiple major centralized exchanges rather than a single venue. This distinction is important: the concentration across several platforms means a move to that level would trigger simultaneous forced selling on multiple order books, rather than isolated liquidation on one exchange.
Liquidation clusters of this size have historically acted as magnets for volatility. When a significant portion of leveraged longs sits at a defined level, any price decline toward that zone risks triggering a feedback loop where initial liquidations push the price lower, activating further liquidations in sequence. This dynamic is particularly relevant in markets where protocols like Aave have experienced large deposit movements under stress conditions, showing how cascading risk can propagate across both centralized and decentralized platforms.
How Forced Selling Can Amplify a Downturn
When exchanges liquidate long positions, they execute market sell orders against existing order book depth. If multiple exchanges liquidate billions in longs simultaneously, the combined sell pressure can temporarily overwhelm available buy-side liquidity.
This creates what traders call a liquidation cascade: falling prices trigger liquidations, which generate sell orders, which push prices lower, which trigger more liquidations. The speed of this loop depends on how tightly clustered the liquidation levels are and how thin the order books become during the move.
The scenario is particularly acute on centralized exchanges where leverage ratios can be high. A trader using 10x leverage on a long position needs only a 10% adverse move to face full liquidation. At 20x, that threshold drops to roughly 5%. The density of positions near $60,498 suggests many traders have entered longs with margin buffers that would be consumed by a move to that level.
Once a cluster of leveraged positions has been flushed, selling pressure often subsides rapidly, and the market can stabilize or rebound. The post-liquidation direction depends on spot demand, not derivatives positioning alone.
What Traders Are Monitoring Near the Threshold
Open interest across BTC futures markets serves as one of the clearest signals of leverage buildup. Rising open interest alongside price increases suggests new leveraged longs are entering, which would increase the potential liquidation volume if the market reverses.
Funding rates on perpetual futures contracts offer a second signal. When funding rates are strongly positive, long holders are paying short holders to maintain their positions, indicating crowded long positioning. A persistently high funding rate near the $60,498 zone would suggest the market is especially vulnerable to a leverage flush.
Order book depth around the trigger level is the third variable. Thin buy-side liquidity near $60,498 would mean liquidation sell orders have less cushion to absorb, increasing the likelihood of a sharp wick below the level. Large on-chain fund movements, such as significant borrowing activity routed to exchanges, can also signal that sophisticated participants are repositioning ahead of expected volatility.
All of these indicators should be treated as risk monitoring tools rather than trading signals. The interaction between leverage, liquidity, and spot demand is complex, and no single metric reliably predicts whether the $60,498 level will be tested.
Why Liquidation Estimates Are Scenarios, Not Predictions
The $1.82 billion figure is conditional on a specific price level being reached and on current positioning remaining roughly static until that point. In practice, traders adjust positions continuously. Some will reduce leverage as price approaches their liquidation level, while others may add to positions, shifting the actual liquidation volume higher or lower than the current estimate.
Liquidation maps also depend on the data coverage of the platform producing them. Major CEX data captures the largest venues but does not account for every exchange globally, nor does it include decentralized perpetual platforms. The true market-wide liquidation exposure at any given level is likely larger than what centralized exchange data alone shows.
These estimates are best understood as scenario analysis tools: they reveal where leverage is concentrated and how much forced selling could theoretically occur, but they are not guarantees of execution volume. Actual liquidation totals during a sharp move often differ from pre-event estimates due to partial liquidations, position adjustments, and varying exchange execution mechanics.
For traders tracking these levels alongside broader market developments, including how new self-custody wallet infrastructure is evolving to handle complex DeFi interactions, the liquidation map remains one of several data points informing risk management rather than a standalone signal.
FAQ
What are Bitcoin long liquidations?
A Bitcoin long liquidation occurs when an exchange forcibly closes a leveraged long position because the trader's margin can no longer cover the unrealized loss. The exchange sells the position at market price to prevent the account from going into negative equity.
Why is $60,498 a key BTC level in this scenario?
Liquidation map data shows a dense concentration of leveraged long positions with margin thresholds clustered around $60,498. This makes it a level where a large volume of forced selling could be triggered simultaneously across multiple exchanges.
Does $1.82 billion in liquidations guarantee a deeper BTC crash?
No. The figure represents the estimated volume of positions that would be forcibly closed, not the guaranteed market impact. Post-liquidation price action depends on spot market demand, remaining order book depth, and whether new buyers step in after the leverage is flushed.
What does major CEXs mean in this context?
Major CEXs refers to the largest centralized cryptocurrency exchanges by trading volume, such as Binance, OKX, and Bybit, where the majority of leveraged BTC futures trading occurs. The liquidation estimate covers aggregate data from these venues but does not include all smaller exchanges or decentralized perpetual platforms.
Additional source references: source document 1.
Disclaimer: This article is for informational purposes only and does not constitute financial or investment advice. Cryptocurrency and digital asset markets carry significant risk. Always do your own research before making decisions.
The post Bitcoin Long Liquidations Could Hit $1.82B if BTC Falls Below $60,498 was initially published on Coincu.