The decline follows US inflation rising to a higher-than-expected 3.7%. Stronger inflation can make the Fed more reluctant to lower rates, weakening expectations for cheaper borrowing and eas
The decline follows US inflation rising to a higher-than-expected 3.7%. Stronger inflation can make the Fed more reluctant to lower rates, weakening expectations for cheaper borrowing and easier financial conditions. That can reduce appetite for speculative assets, including crypto.
Bitcoin’s chart has deteriorated alongside that backdrop. Price has moved below its ascending channel, the 50-day simple moving average and a Fibonacci level that had provided a nearby support reference. A rebound now faces those lost levels before it can rebuild the previous rising structure.
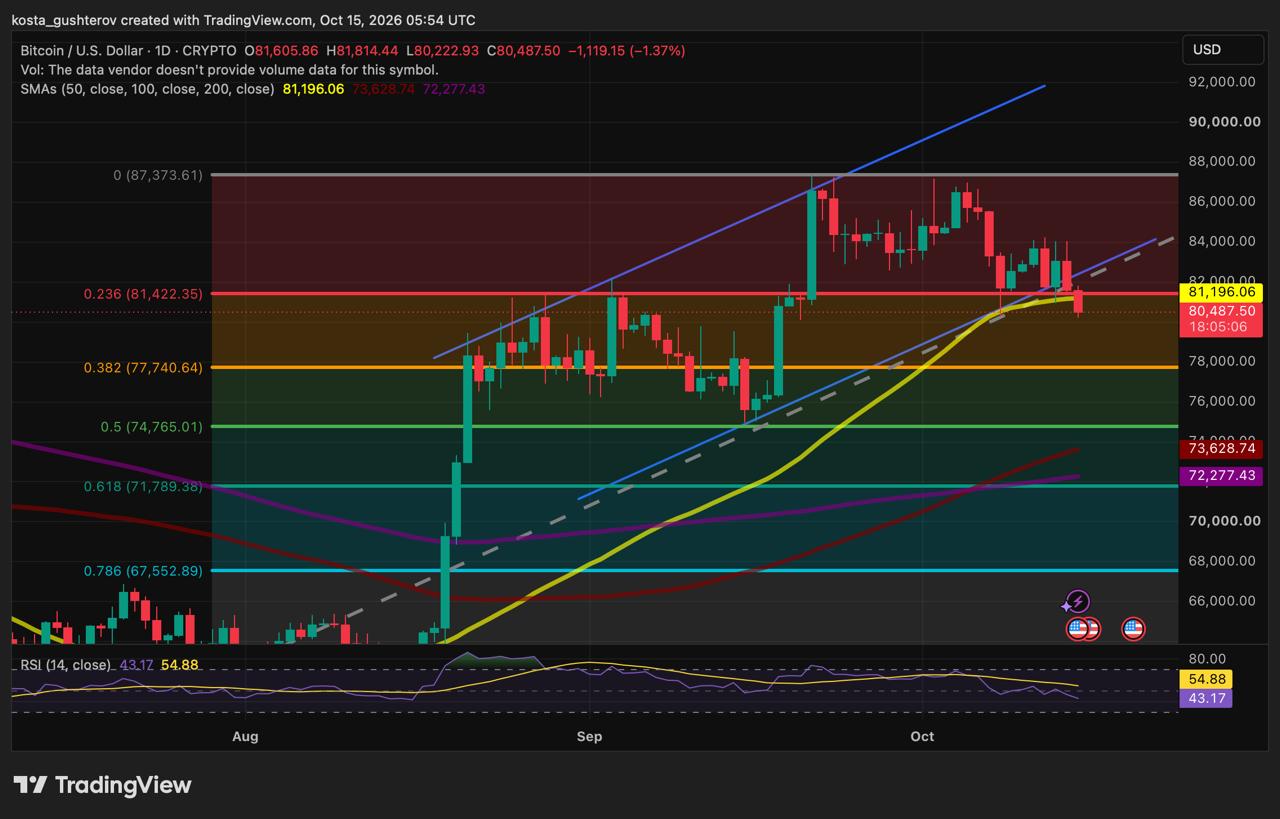
Bitcoin daily
BTC/USD chart for October 15
Bitcoin loses the support area above $81,000
BTC traded near $80,488, down approximately 1.37% on the open October 15 daily candle. Its intraday low near $80,223 brought it within roughly $223 of $80,000, although the round-number level had not yet been reached.
The decline took price beneath the 50-day SMA near $81,196 and the 23.6% Fibonacci retracement near $81,422. Those two references are only about $226 apart, making $81,200–$81,400 the first recovery area to watch.
The break below the rising channel adds a separate concern. Within an ascending channel, pullbacks can remain consistent with an uptrend when they find support along the lower boundary. Bitcoin is now trading beneath that boundary, weakening the pattern that had framed its recent advance.
These losses do not establish that every rebound will fail. They do mean that a move back above $81,000 alone would leave work unfinished: Bitcoin would still need to recover the moving average, the Fibonacci level and the channel boundary. The boundary rises over time, so its position must be assessed separately from the fixed $81,422 retracement.
$80,000 is close, but $77,741 is the next Fibonacci reference
The immediate focus is whether buyers respond as Bitcoin approaches $80,000. Round numbers can attract attention and trading activity, but the figure alone does not establish a strong support floor. A brief move beneath it followed by a recovery would also carry a different message from sustained trading below it.
The Fibonacci grid measures the advance from $62,156 to $87,374. Below the current price, its next retracement is the 38.2% level near $77,741—approximately 3.4% beneath $80,488.
A daily close below $80,000, followed by an unsuccessful attempt to recover it, would strengthen the case for a deeper pullback toward that level. It would not guarantee an immediate move there; the response to the break would show whether selling was continuing or buyers were absorbing it.
Momentum currently favours the weaker side of that setup. Daily relative strength index, or RSI, is near 43.2, below its neutral midpoint of 50 and its smoothing line near 54.9. That is consistent with fading upward momentum, although it does not measure how far the decline could extend.
A deeper correction would reach several distinct levels
Below $77,741, the 50% retracement sits near $74,765. The 100-day SMA is lower, around $73,628, followed by the 200-day SMA near $72,277 and the 61.8% retracement near $71,789.
These references span almost $3,000. They should not be treated as one confirmed demand zone or described as a pool of liquidity without order-book or trading evidence. Their value is in separating the stages of a deeper correction: first the midpoint of the measured rally, then the longer-term moving averages and the lower retracement.
The moving averages also change with each session. If Bitcoin reaches them later, their readings may differ from the current figures.
A recovery needs to hold above $81,400
For buyers, the first task is to regain the $81,200–$81,400 area. A daily close above $81,422 would recover both the Fibonacci level and the current 50-day average, improving the short-term setup.
The next pullback would then matter. If the recovered area holds as support and price returns inside the ascending channel, the breakdown would look less convincing. A brief rebound above the level followed by another reversal would leave the weakness unresolved.
A sustained recovery could bring $84,000 back into view, with the $87,374 swing high further above. Regaining $81,422 alone would not establish a bear trap or guarantee a return to the peak; buyers would need to maintain the recovery through the intervening levels.
The inflation backdrop could complicate that effort. If traders continue to scale back expectations for rate cuts, Bitcoin may face pressure even after an initial bounce. For now, price is below its former support area and approaching $80,000, leaving buyers to establish a floor before the chart can show a durable recovery.
This article is provided for informational purposes only and does not constitute financial or investment advice. Technical levels and indicators are interpretive tools, not guarantees of future price movement.
The post Bitcoin Loses $81,400 Support, $80,000 Comes Into Focus appeared first on Coindoo.