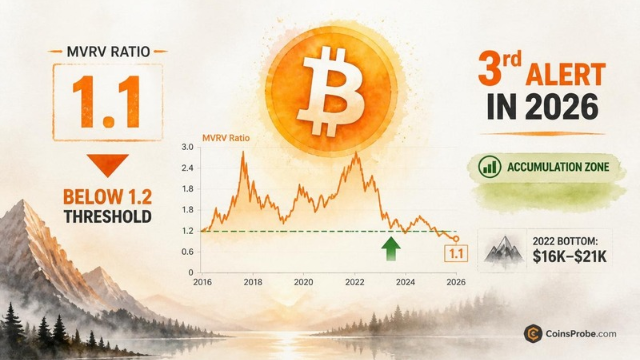
Key Highlights Bitcoin is trading at $64,306 (-1.54%) as MVRV drops below 1.2 for the third time in the 2026 bear market CryptoQuant analyst: MVRV below 1.2 has "always" signaled a forming ma
Key Highlights
Bitcoin is trading at $64,306 (-1.54%) as MVRV drops below 1.2 for the third time in the 2026 bear market
CryptoQuant analyst: MVRV below 1.2 has "always" signaled a forming market bottom — same threshold marked BTC's $16K–$21K bottom in 2022
Third 2026 trigger: prior alerts fired in February ($60K) and June–July ($57K) — both prior to price recovery
Watch MVRV 1.1 as the deeper capitulation threshold; recovery above 1.2 signals the bottom-formation phase is complete
Bitcoin is trading at $64,306 — down 1.54% in the past 24 hours — with a market cap of approximately $1.29 trillion. Beneath the price action, a historically precise on-chain signal has just re-triggered for the third time in this bear market cycle: the MVRV ratio has dropped below 1.2, a threshold that CryptoQuant’s on-chain analyst identifies as one of the most reliable bottom indicators in Bitcoin’s entire history.
In a note published November 15, 2026, to CryptoQuant’s Quicktake platform, an on-chain analyst wrote: “Historically, when the MVRV ratio dropped below 1.2, it has always signaled a forming market bottom, presenting a strong buying opportunity.” The word “always” is not rhetorical. According to the published analysis, this threshold has never failed to precede a recovery — across every major cycle documented on the chart.
MVRV — Market Value to Realized Value — measures the ratio between Bitcoin’s current market capitalization and its realized capitalization. Realized capitalization values each unspent transaction output (UTXO) at the price when it last moved on-chain, effectively representing the aggregate cost basis of all BTC holders. A high MVRV reading indicates that the market price is significantly above what holders paid — signaling elevated unrealized profits and potential selling pressure. A low MVRV reading means the opposite: the market is trading near or below aggregate cost basis, indicating undervaluation and historically reduced sell-side incentive.
The 1.2 threshold is not arbitrary. As noted in the CryptoQuant report, the alert is calibrated and adjusted over time to account for MVRV’s structural tendency to decline across long-term cycles — meaning the signal is designed to remain relevant as Bitcoin matures, not to apply a static 2017-era threshold to 2026 conditions. The preset is explicitly framed as a mid-term DCA signal, not a short-term trade trigger.
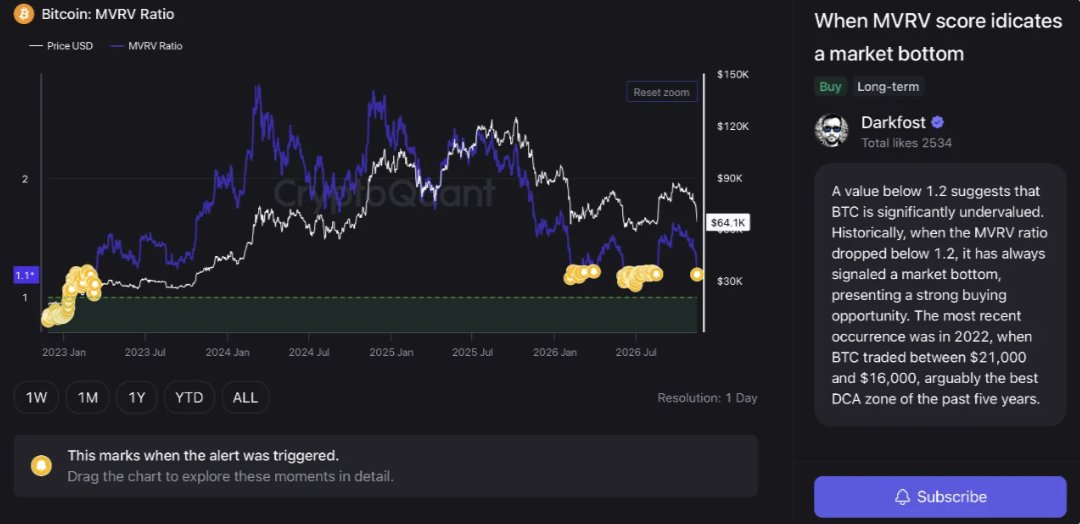
Bitcoin MVRV Ratio Analysis | Source: @cryptoquant_com (X)
According to the CryptoQuant analysis, today’s reading is the third time this alert has fired during the current 2026 bear market. The first trigger occurred in February 2026, when Bitcoin had just crossed below $60,000. The second fired in June–July 2026, when BTC reached $57,000. The report frames both prior triggers as valid DCA zones in hindsight, consistent with the signal’s historical track record. At time of writing, Bitcoin is at $64,306 — above both of those prior trigger levels, which is a significant data point: the market has not broken down from either of the first two signals to new cycle lows.
Before this bear market, the most recent occurrence was in 2022, when Bitcoin traded between $16,000 and $21,000. The analysis describes that zone as “arguably the best DCA zone of the past five years” — a period that preceded Bitcoin’s eventual recovery to all-time highs.
Standard oversold indicators — RSI below 30, negative funding rates, elevated fear-and-greed scores — measure market sentiment or derivatives positioning. MVRV measures something more concrete: the relationship between what the market is paying and what on-chain holders actually paid. When MVRV falls below 1.2, it means Bitcoin’s market cap is within 20% of its realized cap — a condition that has historically represented maximum pain for the marginal seller and minimum incentive to distribute.
The distinction matters because derivatives-based oversold signals can persist for extended periods during structural bear markets. MVRV below 1.2, by contrast, has an unblemished track record as a bottom formation signal across Bitcoin’s documented history per the CryptoQuant analysis. The current bear market, which has already seen broader altcoin capitulation — with TOTAL3 losing its 200-week moving average as one analyst warned of capitulation ahead — provides the macro context for why this MVRV reading carries additional weight right now.
The chart published alongside the CryptoQuant analysis covers approximately 2023–2026 on a daily timeframe, with Bitcoin’s price plotted against the MVRV ratio overlay. A horizontal green dashed line marks the critical 1.1–1.2 zone — the historically significant bottom boundary. Per the chart’s visual analysis, the MVRV ratio has re-approached this green dashed threshold, with the latest alert cluster appearing at this level. The current price callout on the chart reads $64,100, with the chart annotating the MVRV level at 1.1. The pattern status remains forming: the MVRV has re-entered the bottom zone, but no confirmed price reversal breakout is yet visible at the chart’s right edge — meaning the signal is active but the follow-through is still ahead.
This is not the same as a failed signal. By the CryptoQuant framework, the signal marks the formation of a bottom — not the precise hour of the low. The 2022 signal, for example, fired multiple times as BTC carved its $16,000–$21,000 base before the eventual recovery. The analyst’s framing is explicitly mid-term: the signal is designed for investors building positions over time, not for traders looking for a one-candle reversal. For context on the kind of liquidation-driven volatility that can accompany this zone, Bitcoin’s recent drop to $62K involved a $2 billion liquidation cascade — the type of capitulation event that historically coincides with MVRV compression toward cycle lows.
The CryptoQuant note is precise about what this reading means. It says that MVRV below 1.2 has always marked a forming bottom and presented a DCA opportunity — this is the confirmed historical record. What it does not say: it does not specify the exact price at which Bitcoin will bottom, the duration of the base-building period, or the magnitude of the subsequent recovery. The 2022 bottom zone spanned a range from $21,000 to $16,000 over several months before the recovery took hold. Investors deploying capital at the current MVRV signal should frame the position accordingly — as a mid-term accumulation thesis, not a one-week trade.
The one additional confirmation the analyst notes is relevant: the signal is adjusted over time to remain valid as MVRV structurally drifts lower. This means it is a calibrated alert, not a static historical rule being force-fitted to new market conditions.
The chart annotates the bottom boundary of the MVRV threshold zone at approximately 1.1. A sustained move of MVRV below 1.1 would represent a deeper undervaluation than any of the prior three 2026 trigger points, and would historically represent the most extreme buying opportunity within this framework. Conversely, MVRV recovering back above 1.2 and trending toward 2.0 would signal that the bottom-formation phase has transitioned into a recovery regime — which is the condition the 2022 bottom eventually produced before BTC’s multi-year recovery.
At $64,306, Bitcoin is currently within the zone the CryptoQuant MVRV framework has identified — three times in this cycle alone — as a DCA opportunity. The signal has never been wrong about the eventual direction. The question it leaves open is timing. Watch MVRV relative to 1.1 as the near-term tell: a dip below it would deepen the capitulation signal, while a recovery above 1.2 would indicate the bottom-formation phase is complete.
Disclaimer: The views and analysis presented in this article are for informational purposes only and reflect the author’s perspective, not financial advice. Technical patterns and indicators discussed are subject to market volatility and may or may not yield the anticipated results. Investors are advised to exercise caution, conduct independent research, and make decisions aligned with their individual risk tolerance.
Read Also: HYPE Hits Critical Liquidation Zone at $66.13 — Sharp Move Imminent