Bitcoin News Today: Can BTC Recover After a 24.6% Drop? The top crypto dropped sharply on November 15, sweeping under $62,500, and then bounced back. This is the full Bitcoin News Today brief
Bitcoin News Today: Can BTC Recover After a 24.6% Drop?
The top crypto dropped sharply on November 15, sweeping under $62,500, and then bounced back.
This is the full Bitcoin News Today briefing in plain language: the latest market numbers, the price levels traders are watching, and why forced selling and fear matter.
Every figure comes from live market data pages or the chart, so you can check it yourself.
Where the Market Stands Right Now
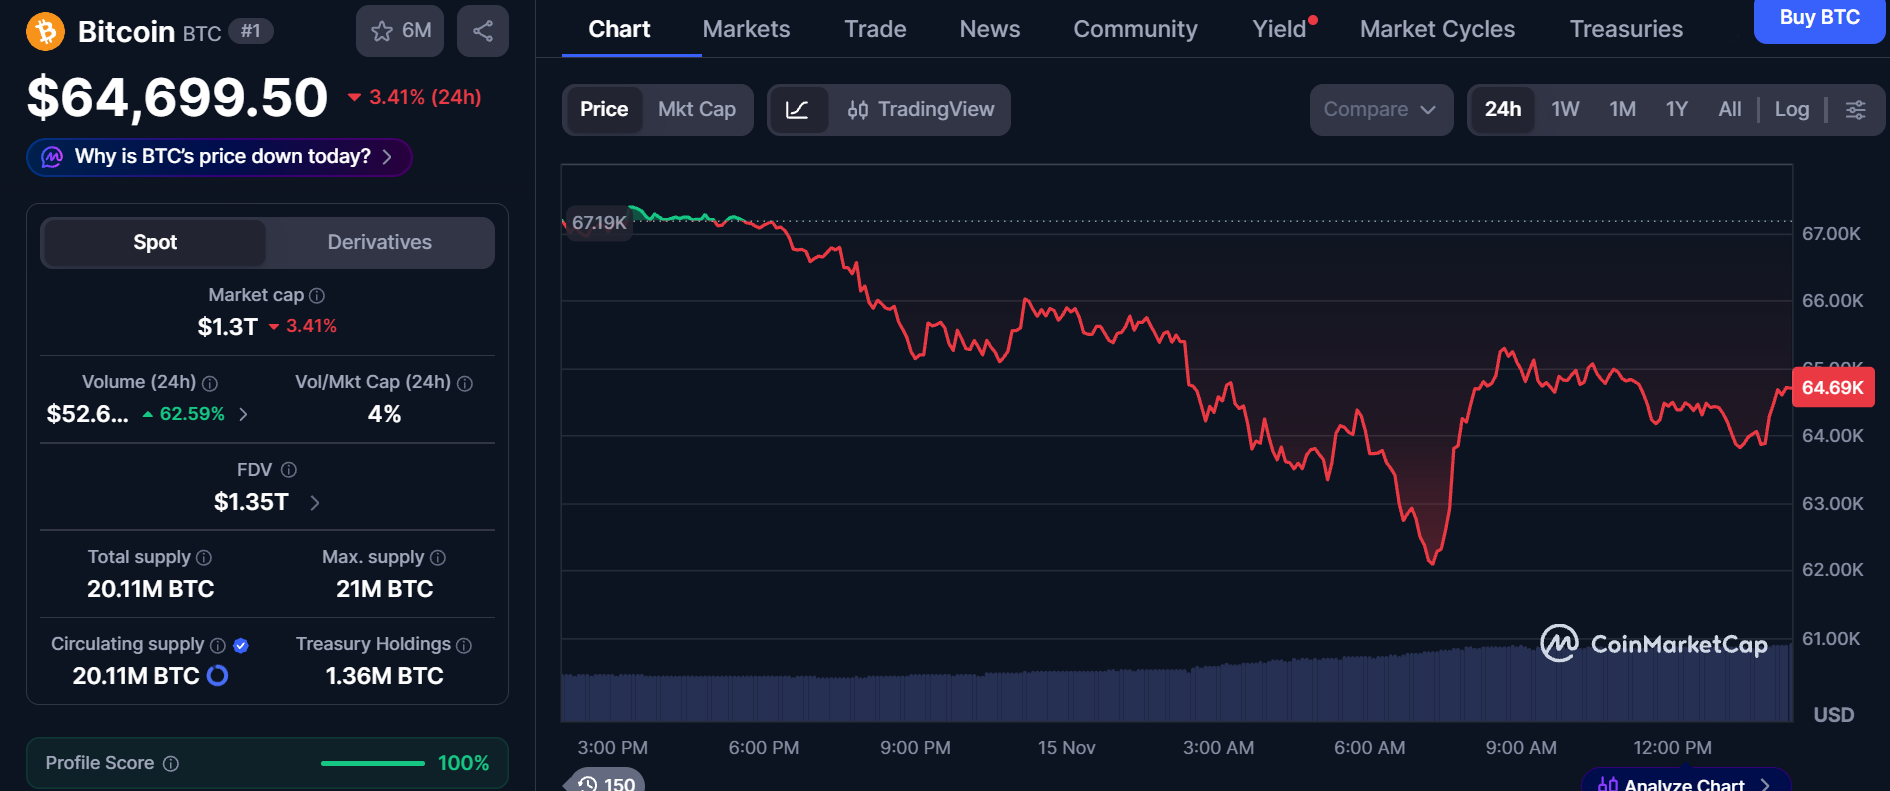
According to the live market page, BTC traded at $64,699.50, down 3.41% in 24 hours, when the data was captured.
The 24-hour chart on that page starts near $67,190, falls to roughly $62,000, and then recovers.
A later check of the same page showed about $66,600, so figures keep moving.
Metric
Value
Price
$64,699.50
24-hour change
-3.41%
Market cap
$1.3 trillion
24-hour volume
About $52.6 billion (+62.59%)
Volume to market cap
4%
Source: CoinMarketCap Live Data
Volume jumped 62.59%, so far more coins changed hands than the day before. That usually points to panic selling and bargain hunting at the same time.
About 95.8% of all coins that will ever exist are already in circulation, and the 21 million cap has not changed.
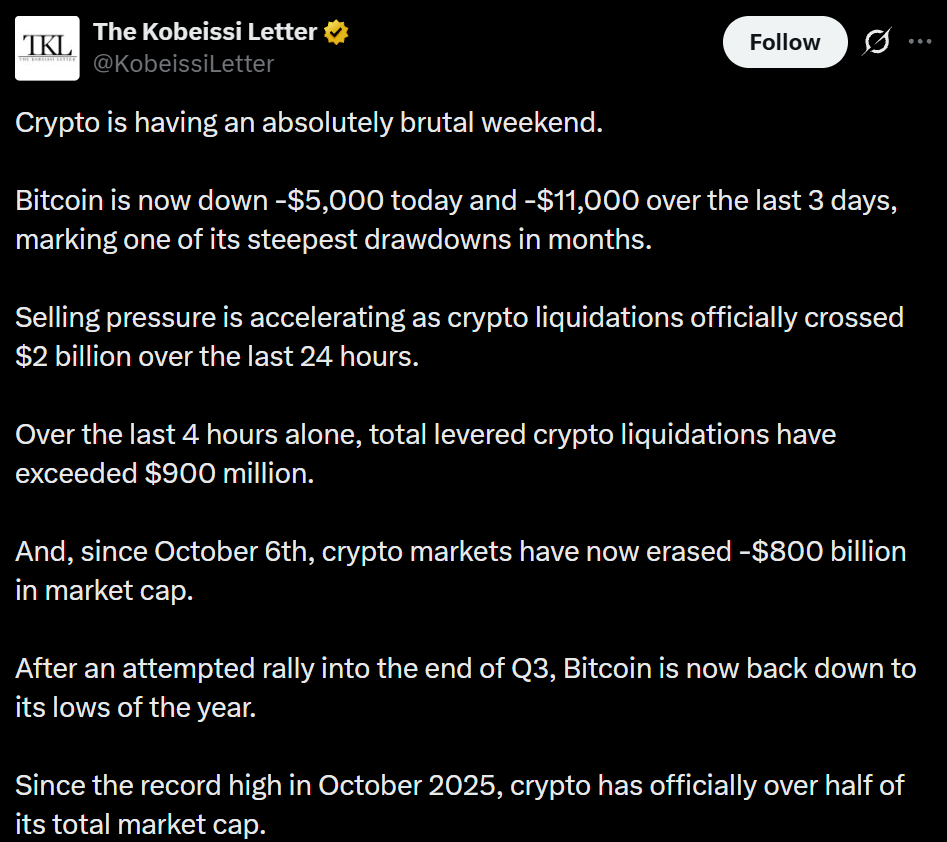
A 24% Fall Since October 6
Thehistorical snapshot for October 6, 2026 lists BTC at $85,785.56 with a market cap of about $1.72 trillion. Against $64,699.50, that is a drop of about 24.6% in 40 days (our calculation).
Source: Kobeissi Letter
The market page lists the record high as $126,198.07 on October 6, 2025. That puts the coin about 48.7% below its peak (our calculation).
Date
Price
What it shows
October 6, 2025
$123,510.07
Record high
October 6, 2026
$85,785.56
Snapshot
November 15, 2026
$64,699.50
Latest screenshot
The four-hour chart shows how the fall unfolded (approximate readings):
Early to mid October: trading between about $80,000 and $87,000
Late October to early November: held near $76,400 for about a week, bounced toward $81,000, then broke below it
Around November 12 to 13: lost $72,000, and the fall sped up
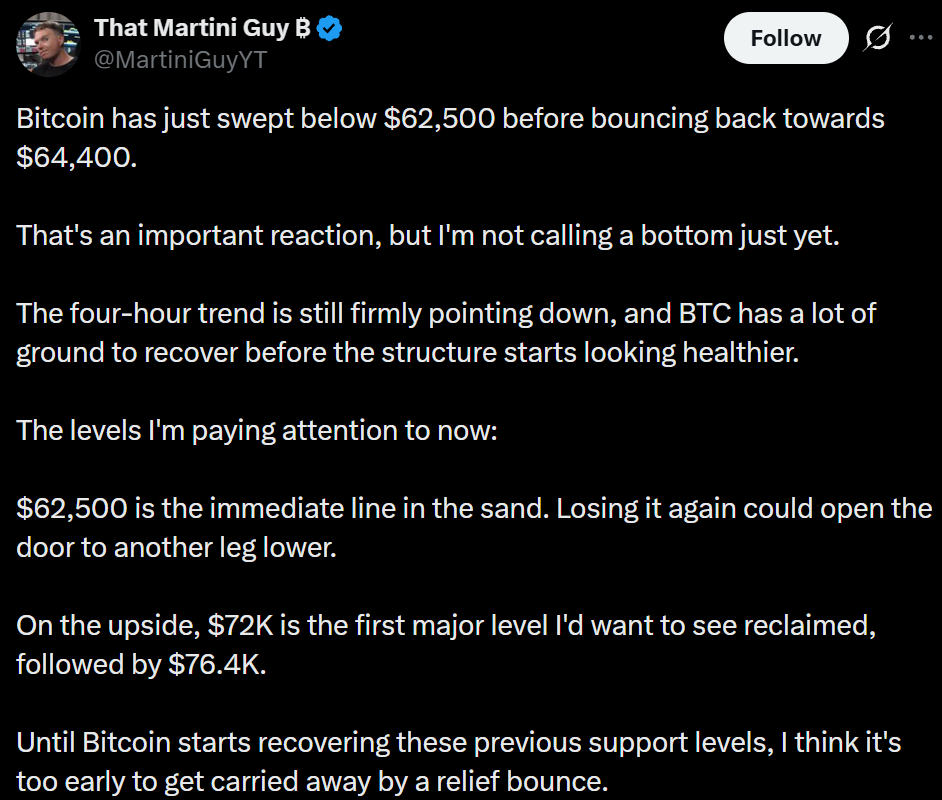
November 15: dipped under $62,500, then bounced
Key Price Levels on the Four-Hour Chart
For anyone reading Bitcoin News Today, the four-hour chart gives clear markers.
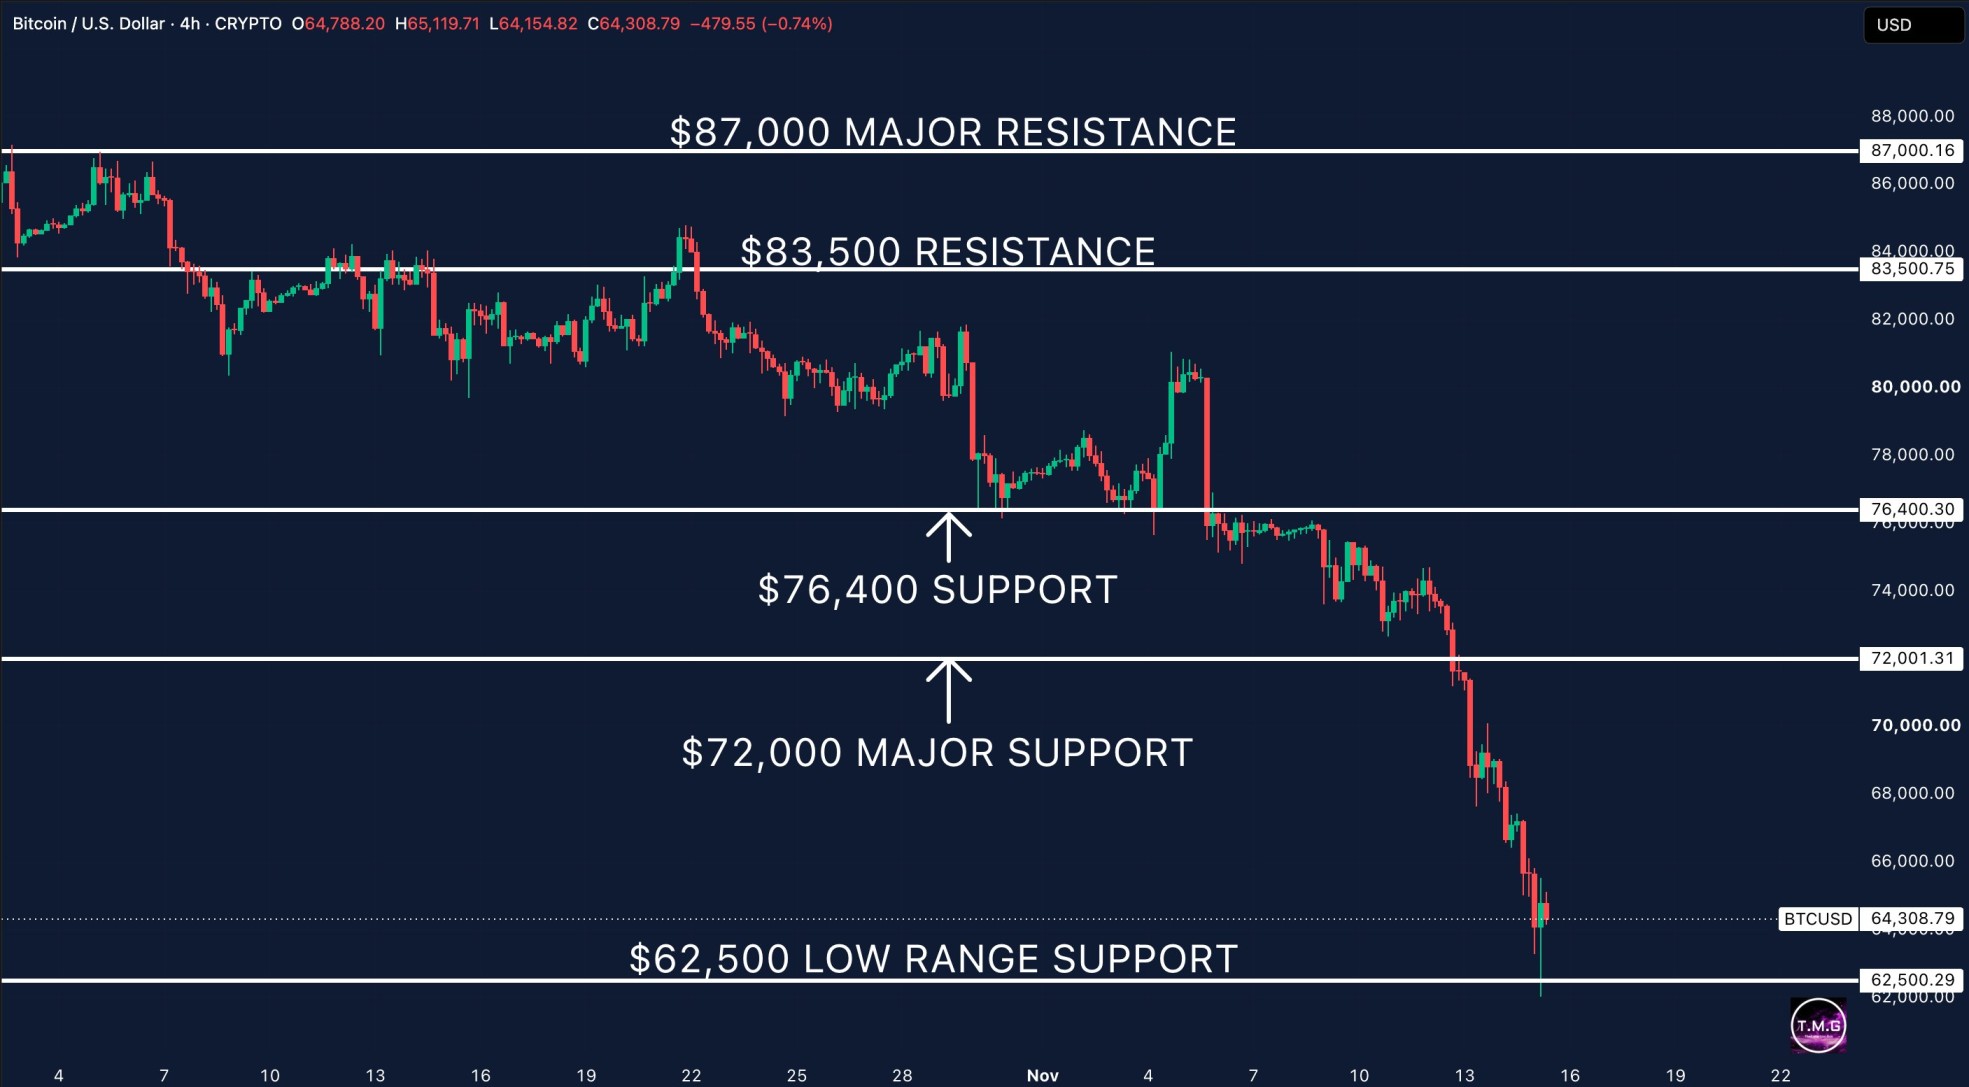
The last candle opened at $64,788.20, reached $65,119.71, dipped to $64,154.82 and closed at $64,308.79, down 0.74%.
Level
Role
Distance from last close
$62,500
Low-range support
About 2.8% below
$72,000
Major support, now overhead
About 12.0% above
$76,400
Support, now overhead
About 18.8% above
$83,500
Resistance
About 29.8% above
$87,000
Major resistance
About 35.3% above
Support is a level where buyers have stepped in before. Resistance is where sellers have.
Source: Post on X
When support breaks, it often turns into resistance, so $72,000 and $76,400 now sit above the market. These levels are tools, not predictions.
Why Forced Selling and Fear Matter
A liquidation happens when a trader who borrowed money to bet bigger can no longer cover losses, and the exchange closes the position automatically.
As theliquidations dashboard explains, this adds forced selling, which can push prices lower and trigger more liquidations. Live totals change by the hour, so check that page for current numbers.
TheFear and Greed Index scores market mood from 0 to 100, where lower means more fear. It read about 16 to 17 when checked, which is deep in fear territory.
The index blends five inputs:
Price momentum of the top coins
Expected volatility
Options market bets
Bitcoin’s size compared with stablecoins
Social trends and user engagement
The page itself says the index should be used with other tools, not alone.
What to Watch Next
Several things will shape the next move:
Whether $62,500 holds on another test
Whether the coin can reclaim $72,000, the first big level overhead
Whether volume stays high on bounces or fades
Whether liquidation totals and fear readings cool down
Anyone following Bitcoin News Today should remember that fast moves and borrowed money cut both ways. Bounces can also fade while the four-hour trend stays lower.
Conclusion
BTC has fallen about 24% since October 6, wicked under $62,500 and bounced. The next test is whether buyers can defend that floor and start climbing back toward $72,000.
Until then, fear is high and moves are sharp. Bitcoin News Today comes down to this: check live data before acting. This article is for information only, not financial advice.
Disclaimer
This article is for educational and informational purposes only and is not financial or investment advice. Crypto assets are high risk, their prices can be very volatile, and you can lose some or all of your money. Always do your own research and consider speaking with a licensed financial advisor before making investment decisions.