Bitcoin is attempting to stabilize after another defense of the $80K demand zone. The biggest crypto asset is now trading around $82.8K and remains below the $88K resistance area that rejecte
Bitcoin is attempting to stabilize after another defense of the $80K demand zone. The biggest crypto asset is now trading around $82.8K and remains below the $88K resistance area that rejected its recent advance, leaving the market between a continuation of the broader recovery and a deeper correction toward lower support.
Meanwhile, the Adjusted SOPR suggests that profit-taking remains moderate, although the metric has started to cool alongside the latest pullback.
Bitcoin Price Analysis: The Daily Chart
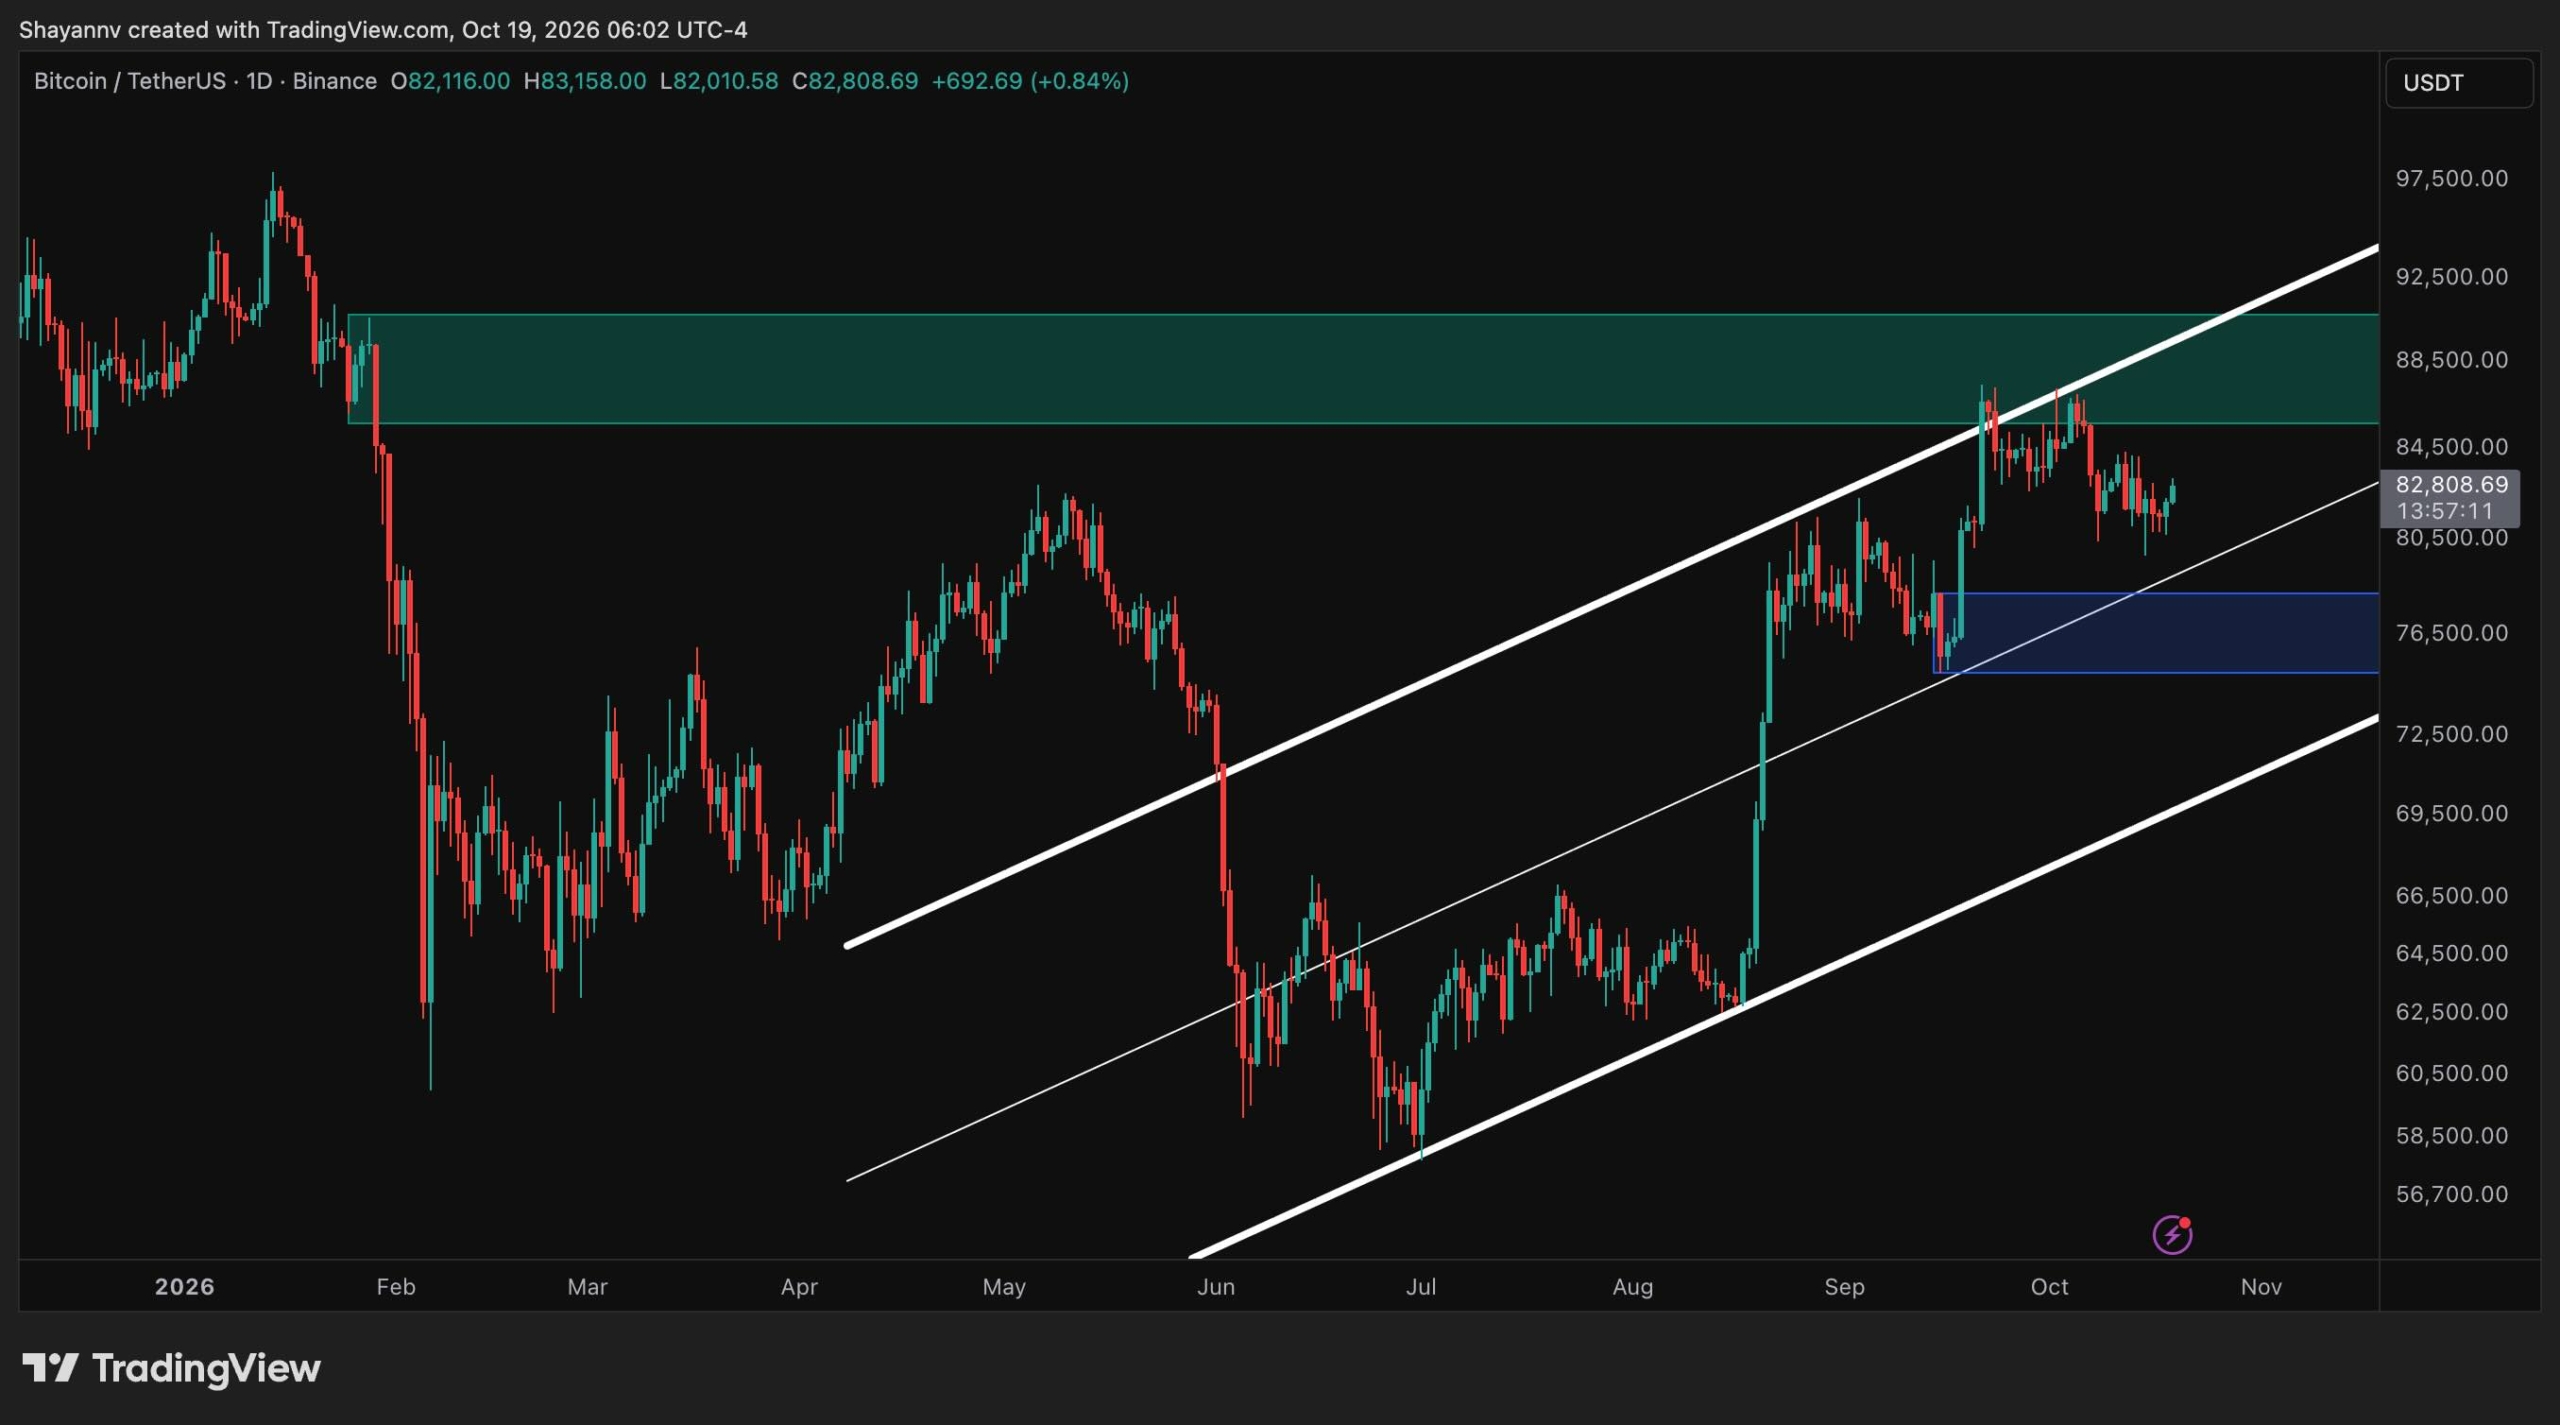
On the daily timeframe, BTC continues to trade within the ascending channel that has guided the recovery from the late-June lows near $58K. The sharp rally in late September carried the price into the channel’s upper boundary, which overlapped with the major supply zone around $88K. This region marks the origin of the late-January breakdown, and sellers have once again defended it, rejecting BTC twice near $88K in late September and early October.
Following the rejection, the price has retreated toward the channel’s midpoint, which is currently converging with the $80K area. Buyers have so far defended the recent lows, and holding above this region would keep the structure constructive and support another attempt toward the $85K supply boundary. A decisive breakout above the zone would be required to open the path toward the $90K region and beyond.
On the downside, the nearby notable support is the $77K order block, which formed the base of the late-September breakout. A daily candle close below the channel midpoint would likely expose this region, while a breakdown beneath it would bring the channel’s lower boundary, currently around $70K, back into focus. For now, the broader recovery structure remains intact, but the repeated rejections from supply suggest that buyers need to hold the midpoint to preserve it.
BTC/USDT 4-Hour Chart
The 4-hour chart shows that Bitcoin has formed a series of lower highs since the rejection from the $86K-$88K region in early October, with subsequent rebounds stalling near $84K. Despite this, the price remains within the short-term ascending channel, and every decline since early October has been absorbed by the $80K demand zone, which served as the consolidation base before the strong rally in late September. This zone now overlaps with the channel’s rising lower boundary, creating a meaningful support confluence.
The latest impulsive move away from this confluence has left a bullish fair value gap below the current price, suggesting that buyers have stepped in with notable strength. If this imbalance holds on a retest, BTC could extend its relief bounce toward the $84K rebound highs, followed by the $86K supply zone, where the early-October breakdown began.
Conversely, failure to hold the fair value gap would return the price to the $80K demand zone for another test. Repeated tests tend to weaken support, and a valid break below both the zone and the rising trendline would invalidate the current stabilization attempt, exposing the $75K order block. The short-term structure therefore favors a cautious recovery, but buyers still need to clear $84K level to end the sequence of lower highs.

On-Chain Analysis
The Adjusted Spent Output Profit Ratio (aSOPR), shown here through its 30-day exponential moving average on CryptoQuant, measures whether coins moved on-chain are being spent at a profit or a loss, excluding outputs younger than one hour. Readings above 1 indicate that spent coins are realizing profits on average, while readings below 1 suggest coins are being sold at a loss, a behavior often associated with capitulation phases.
The metric dropped below 1 in early 2026 and reached approximately 0.98 in February, coinciding with BTC’s slide toward the $60K region. After a brief recovery in spring, it fell below the threshold again during the June decline, before climbing steadily alongside the price since July. The 30-day EMA peaked near 1.013 in early October and has since begun to turn lower, indicating that profit realization is easing as the price retreats from resistance.
Notably, current readings remain well below the 1.05–1.08 peaks recorded during the 2024 and 2025 rallies, suggesting that profit-taking is still moderate rather than euphoric and that the market is not yet overheated. However, the metric does not by itself confirm the trend. During healthy uptrends, aSOPR tends to hold above 1 as holders refuse to sell at a loss, so a renewed drop below this threshold while BTC loses the $80K support would signal weakening conviction.

The post Bitcoin Price Analysis: Can BTC Reclaim $84K Before Another Slide Toward $77K? appeared first on CryptoPotato.