Bitcoin has confirmed a major rounding top breakdown after losing the $65,000 support zone, with technical indicators and derivatives positioning pointing to a possible decline toward the mid
Bitcoin has confirmed a major rounding top breakdown after losing the $65,000 support zone, with technical indicators and derivatives positioning pointing to a possible decline toward the mid-$40,000 range.
Summary
- Bitcoin price has broken below the neckline of a major rounding top pattern, with the chart projecting a downside target near $47,000.
- Spot Bitcoin ETFs recorded $213.8 million in outflows on June 10, extending a four-day withdrawal streak after a 13-day selloff that drained $4.33 billion.
- Liquidation clusters around $64,000-$65,000 remain a key resistance zone, while losing $60,000 support could accelerate downside pressure.
According to data from crypto.news, Bitcoin (BTC) price traded near $62,900 on June 11 after recovering from a sharp selloff that briefly pushed the asset below $61,000 earlier in the week.
Market sentiment remains fragile as investors continue digesting persistent spot ETF outflows, geopolitical tensions in the Middle East, and growing concerns that capital is rotating into high-profile technology opportunities instead of crypto assets.
SoSoValue data shows that the U.S. spot Bitcoin ETFs recorded another $213.8 million in net outflows on June 10, extending the current losing streak to four consecutive sessions.
The withdrawals followed a modest $3 million inflow on June 4, which briefly interrupted a 13-day outflow streak that saw $4.33 billion leave Bitcoin investment products. The prolonged selling pressure has removed one of the market’s strongest sources of demand during the recent correction.
You might also like: Bitcoin’s next rally may depend on Congress, O’Leary says
Institutional sentiment has also weakened on spot exchanges. Earlier this month, the Coinbase Premium Index dropped into negative territory, showing that U.S.-based investors were selling Bitcoin more aggressively than traders on offshore venues. At the same time, derivatives markets experienced a wave of forced liquidations that erased more than $1.7 billion in leveraged positions during the selloff.
Additional pressure came from outside the crypto market. According to a recent crypto.news report, CNBC host Jim Cramer described Bitcoin and gold as “bad money” while arguing that investors were reallocating capital toward technology stocks and private market opportunities such as SpaceX. His comments arrived as Bitcoin fell toward the $60,000 region before staging a modest rebound.
Bitcoin chart projects downside target near $47,000
The daily chart shows Bitcoin completing a large rounding top formation that developed between March and early June. The pattern’s neckline sat near $65,000, a level that had repeatedly acted as support before giving way during last week’s decline.
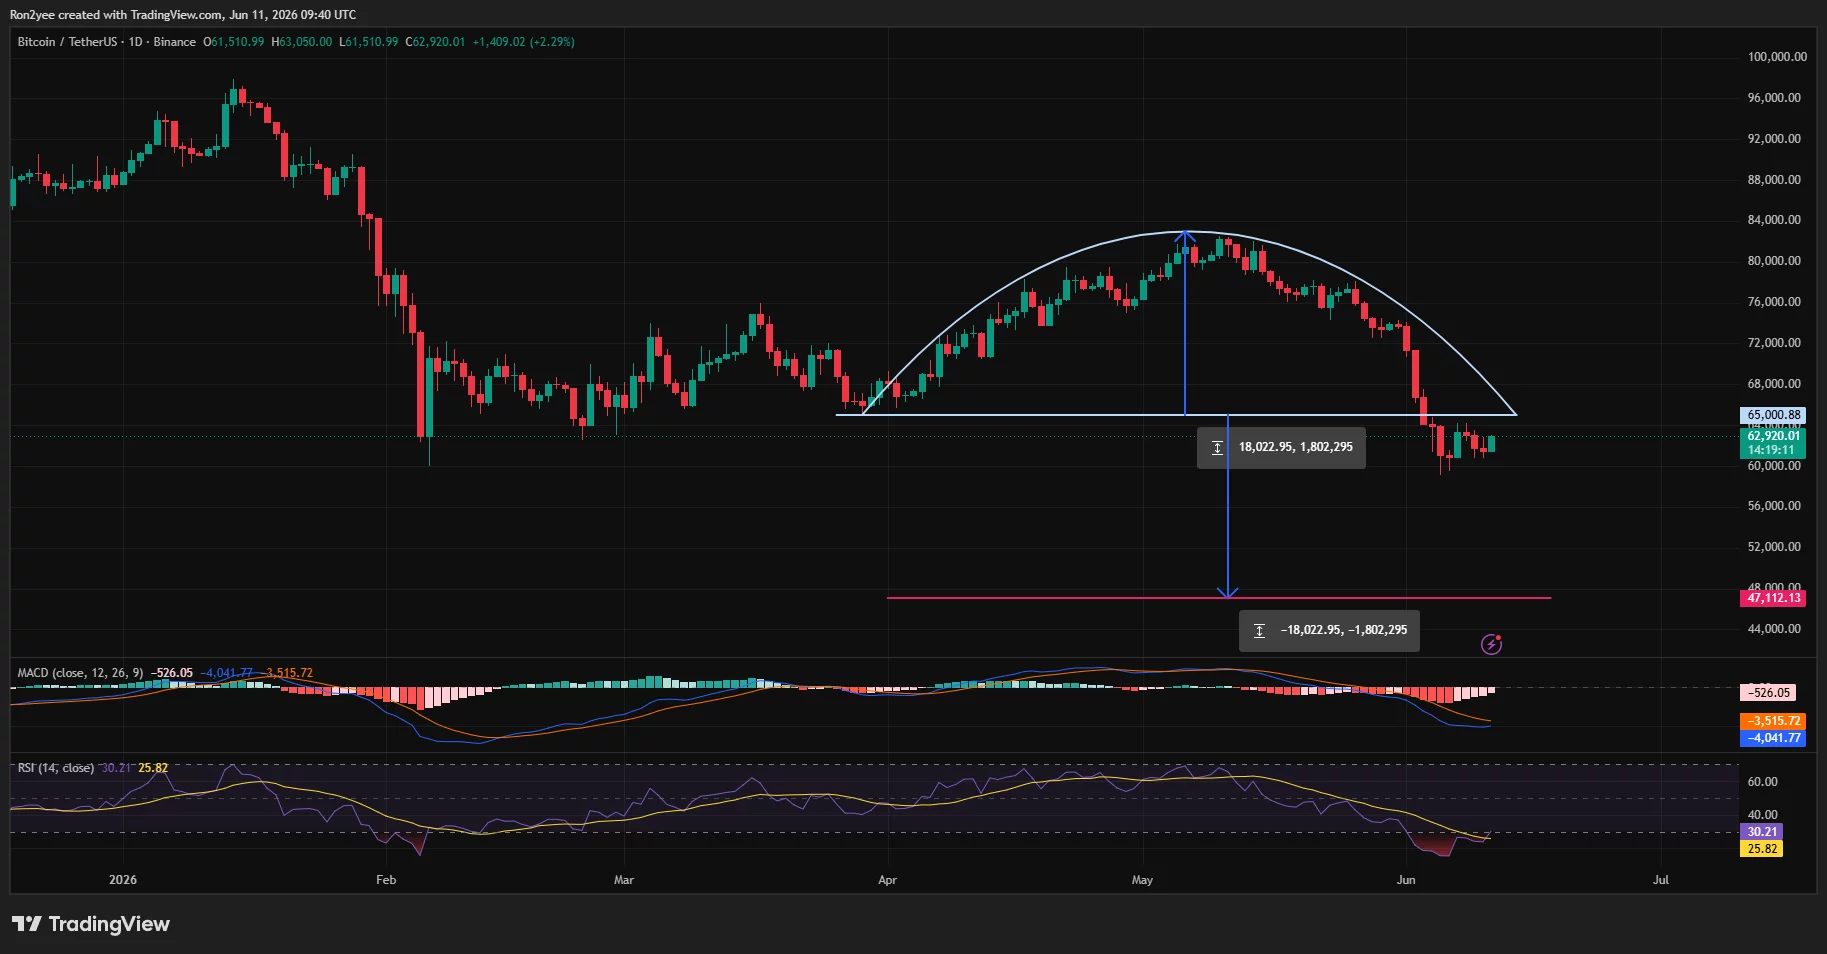
Bitcoin price has broken below a rounding top pattern on the daily chart — June 11 | Source:
crypto.newsUsing the depth of the formation, the measured downside target sits near $47,000, implying roughly 25% downside from current levels. The projected objective aligns with a major support zone that previously acted as resistance during Bitcoin’s recovery earlier this year.
Momentum indicators continue to favor sellers. The daily RSI remains near 30, keeping the asset close to oversold territory, while the MACD remains below its signal line with deeply negative readings. Although oversold conditions could support short-term rebounds, neither indicator has confirmed a broader trend reversal.
Derivatives positioning also highlights important battlegrounds. CoinGlass liquidation data shows large concentrations of leveraged positions clustered around $64,000 to $65,000, creating a significant resistance zone above current prices.
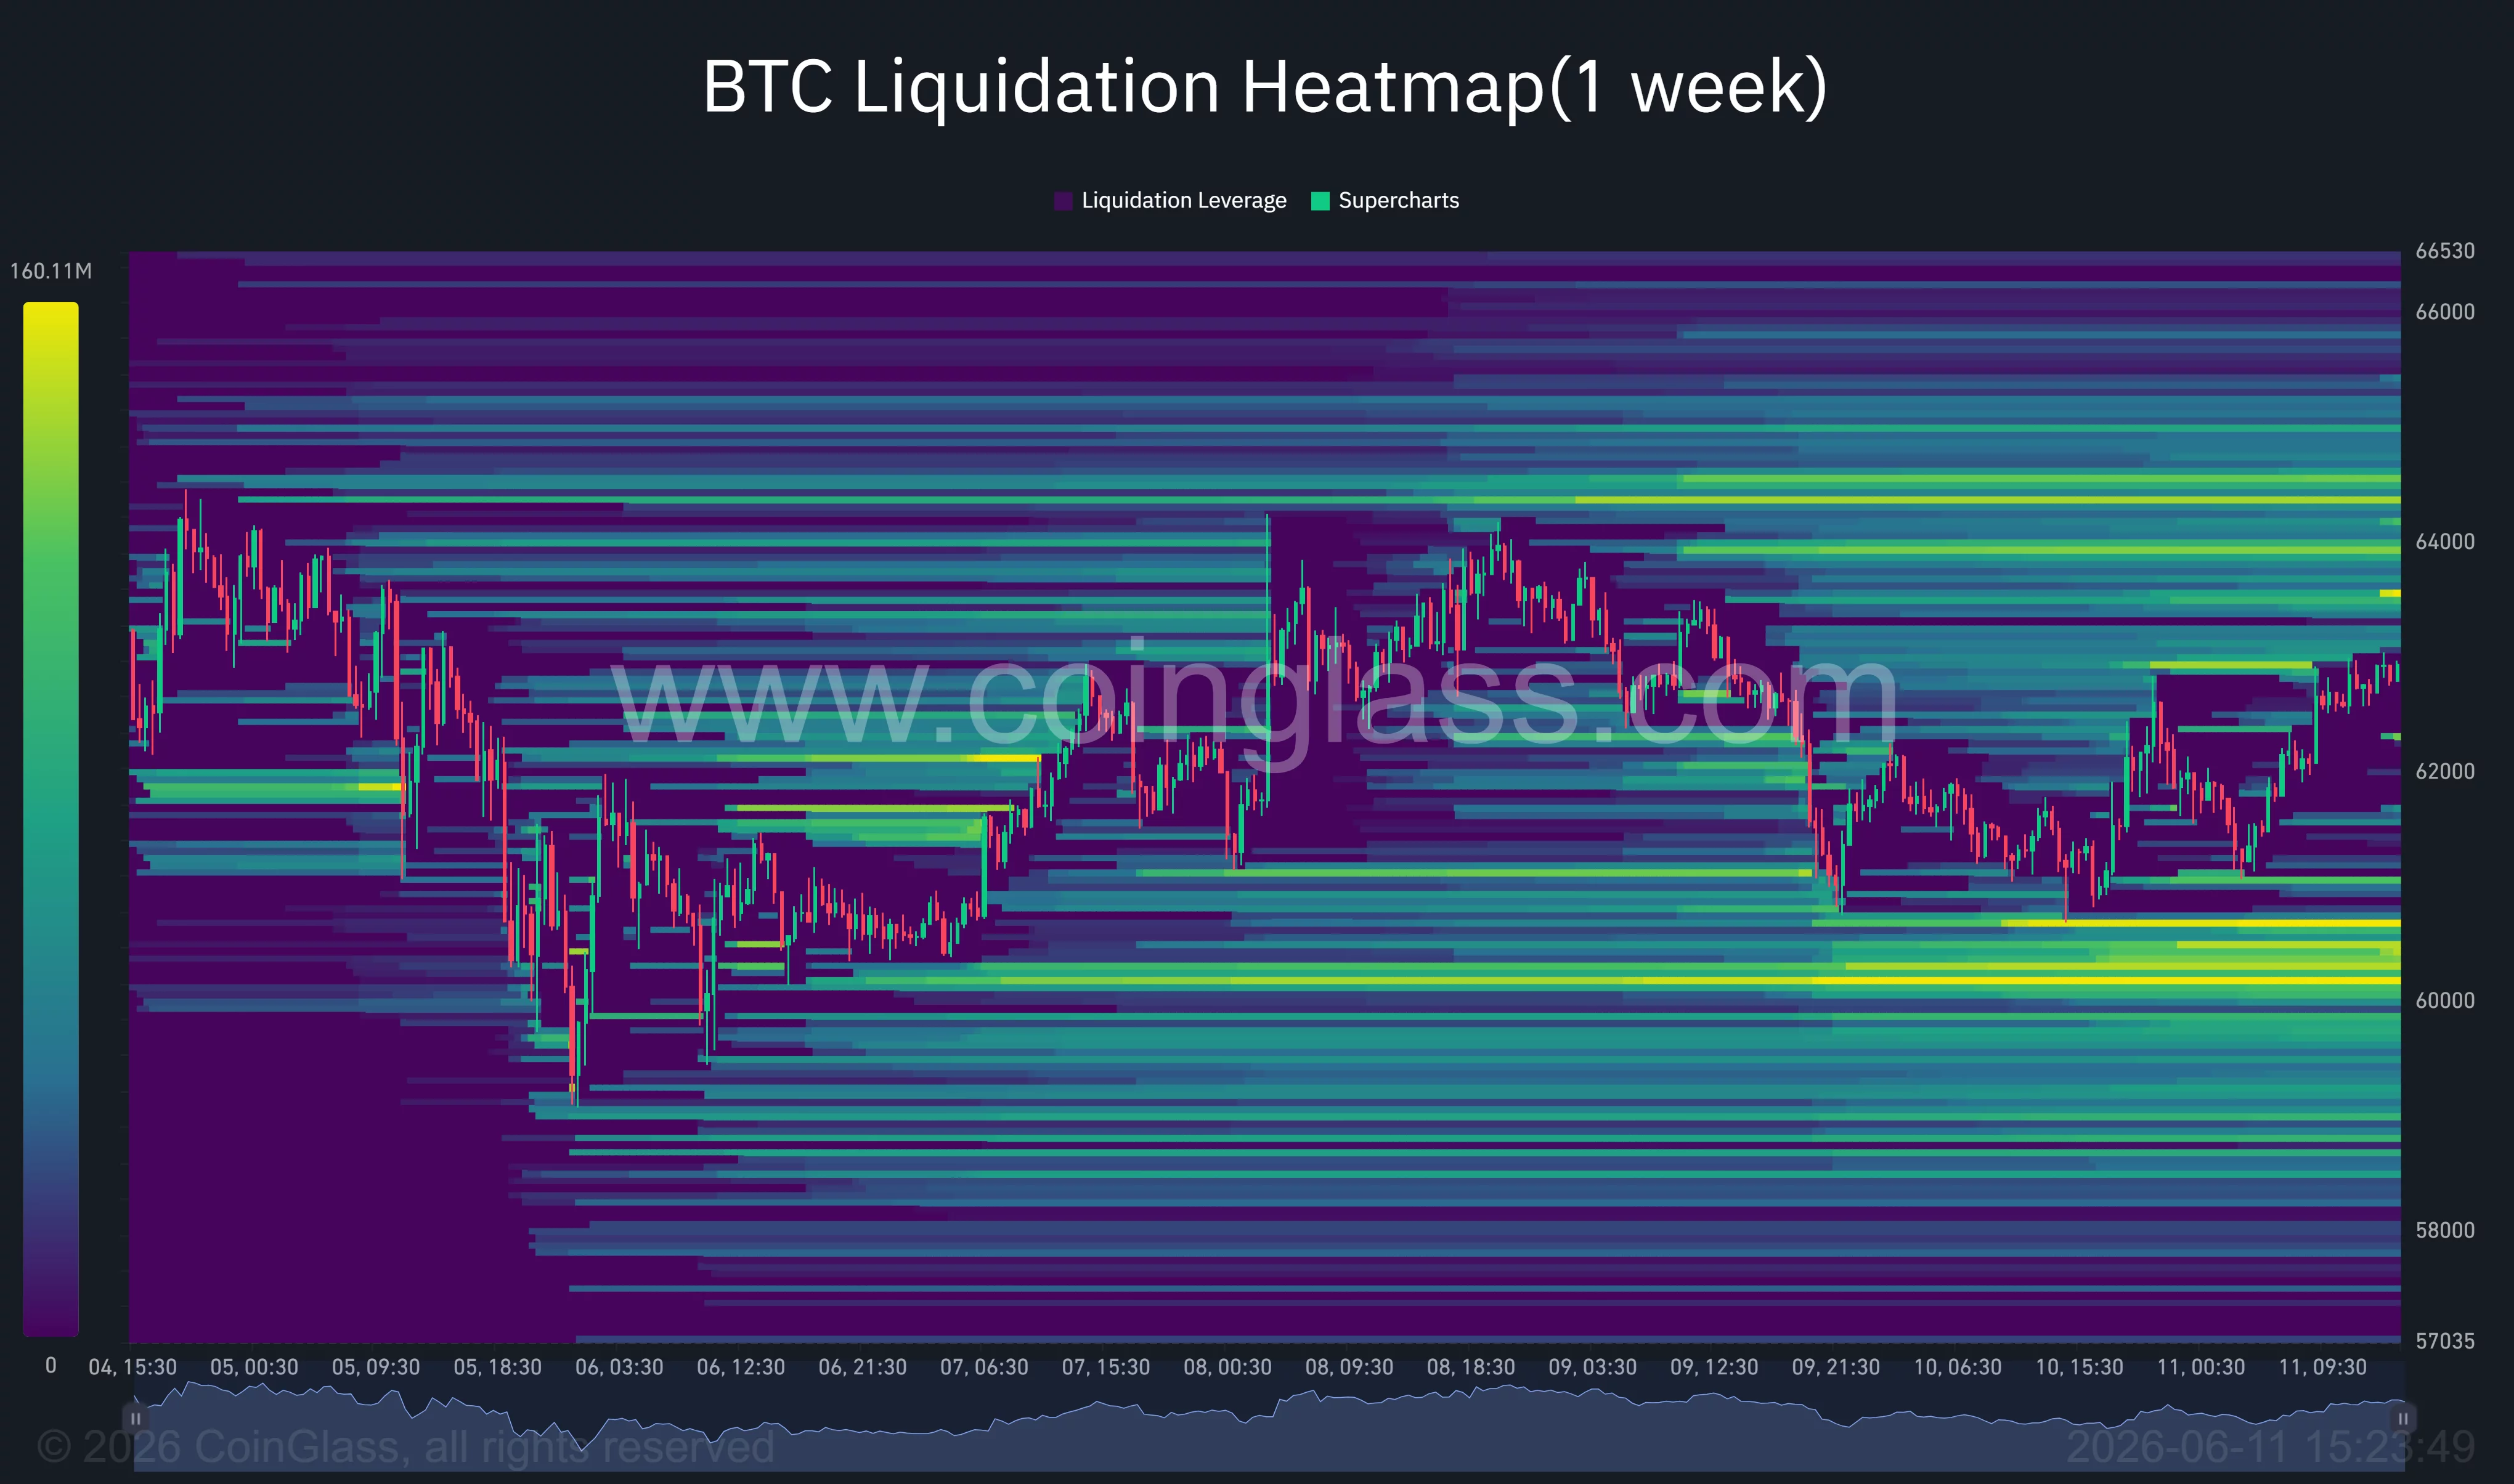
Bitcoin liquidation heatmap | Source:
CoinGlassOn the downside, another major liquidity pocket sits around $60,000, which could attract price if bearish momentum returns.
Commenting on the matter, crypto analyst Michael van de Poppe noted that there was “no clear decision on the path for $BTC as of yet” and argued that technical conditions would remain weak unless Bitcoin reclaimed the $64,000 area.
Macro risks and support levels remain critical
Geopolitical developments remain another source of uncertainty. Oil prices briefly surged after renewed military exchanges between the United States and Iran, although crude later fell below $90 per barrel after the U.S. military announced the completion of its latest strikes and traders began pricing in the possibility of renewed negotiations.
Inflation concerns have also complicated the outlook for risk assets. Any delay in Federal Reserve rate cuts could continue weighing on speculative markets, particularly if investors favor cash, Treasury yields, or technology stocks over digital assets.
Several analysts continue to monitor the $61,000 support area. According to crypto analyst Ted Pillows, Bitcoin has been “holding the $61,000 support zone for now,” even as stocks and precious metals recently posted new local lows.
“It seems like Bitcoin wants a bit higher from here before another low in Q3.”
A sustained recovery above $64,000 would weaken the immediate bearish thesis and place the former breakdown level back into contention. Failure to hold $60,000, however, could expose Bitcoin to a deeper decline toward the $55,000 region before the rounding-top target near $47,000 comes into focus.
Read more: Is Dogecoin’s 31% crash ending as TD Sequential flips bullish?
Disclosure: This article does not represent investment advice. The content and materials featured on this page are for educational purposes only.