Bitcoin price has had more turbulent weeks than peaceful ones in 2026, but the latest slide below $60,000 feels different in tone. It is not the dramatic, leverage-fueled collapse that wiped
Bitcoin price has had more turbulent weeks than peaceful ones in 2026, but the latest slide below $60,000 feels different in tone. It is not the dramatic, leverage-fueled collapse that wiped billions off the board in prior cycles. Instead, it looks more like a slow exhale, a market shedding excess weight before deciding where to go next. The question right now is not whether Bitcoin fell. It is what the underlying data is telling traders who are paying attention.
Bitcoin Price Drop Shakes Short-Term Support at $63K
Bitcoin was trading at approximately $59,500 at the time of writing, having sliced through the $63,000 support zone that held for much of the earlier part of the week. That level mattered to technical analysts who viewed it as a foundation for any near-term recovery. Once it broke, sentiment cooled quickly and the broader market followed suit, with Bitcoin dominance sitting at 55.75% across a total crypto market cap of $2.13 trillion.
The speed of the drop did not trigger panic, but it certainly reset expectations. Traders who positioned around the $63,000 range found themselves reassessing, and that kind of reassessment always creates pressure on the next visible support, which now sits squarely between $59,000 and $60,000.
Bitcoin price (source cryptoquant)
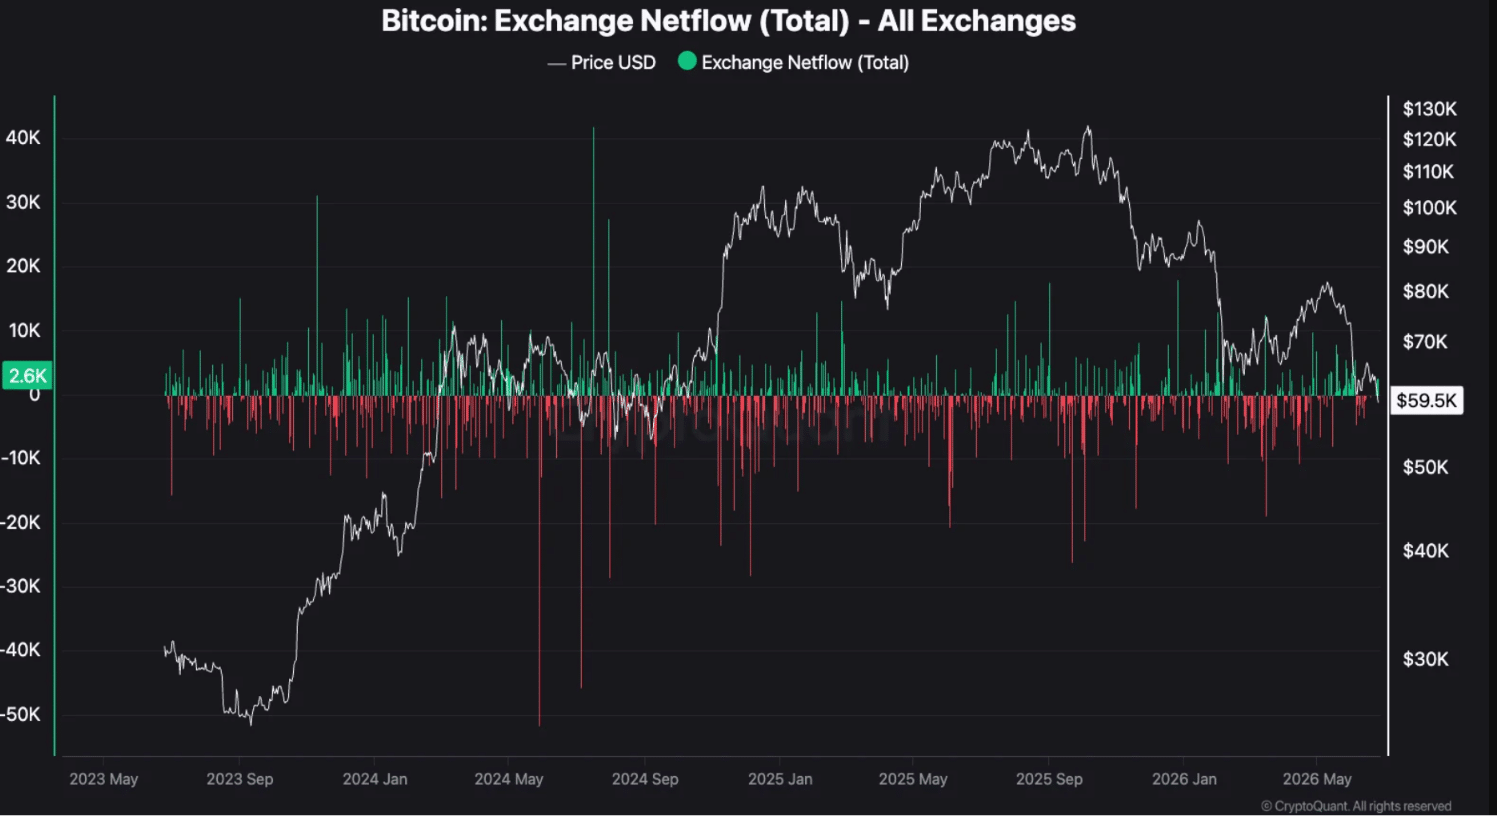
Exchange Netflows Signal Active Participation, Not Full Retreat
One of the more telling data points to emerge from the Bitcoin price drop is the exchange netflow reading. At 2,600 BTC flowing into exchanges on a net basis, the number tells a nuanced story. More Bitcoin was moving onto exchanges than leaving them, even after the correction took hold.
Positive netflows do not always point to imminent selling. They can reflect traders positioning to hedge, institutions rebalancing, or active participants preparing for volatility in either direction. Think of it the way a commodity trader moves product closer to the marketplace before a price swing, not necessarily to dump it, but to stay nimble. The data suggests market participants are alert, not absent.
Open Interest Falls to $20.6 Billion as Leverage Cools Off
Perhaps the most reassuring signal in an otherwise choppy picture is where open interest has landed. Bitcoin OI dropped to around $20.6 billion at press time, well below its 2025 peak. Leverage in the system has visibly cooled, and that matters enormously when interpreting a price decline.
During previous highs, the market was coiled tight with borrowed capital. A move of a few percentage points in the wrong direction triggered cascading liquidations that amplified losses far beyond what fundamentals would have justified. That risk profile looks markedly different today. With OI lower and leverage calmer, the current Bitcoin price drop appears less likely to spiral into a liquidation-driven freefall.
This is what analysts refer to as a “reset” environment, where the market flushes out speculative excess and creates a cleaner base for the next leg, whatever direction that takes.
Bitcoin price graph
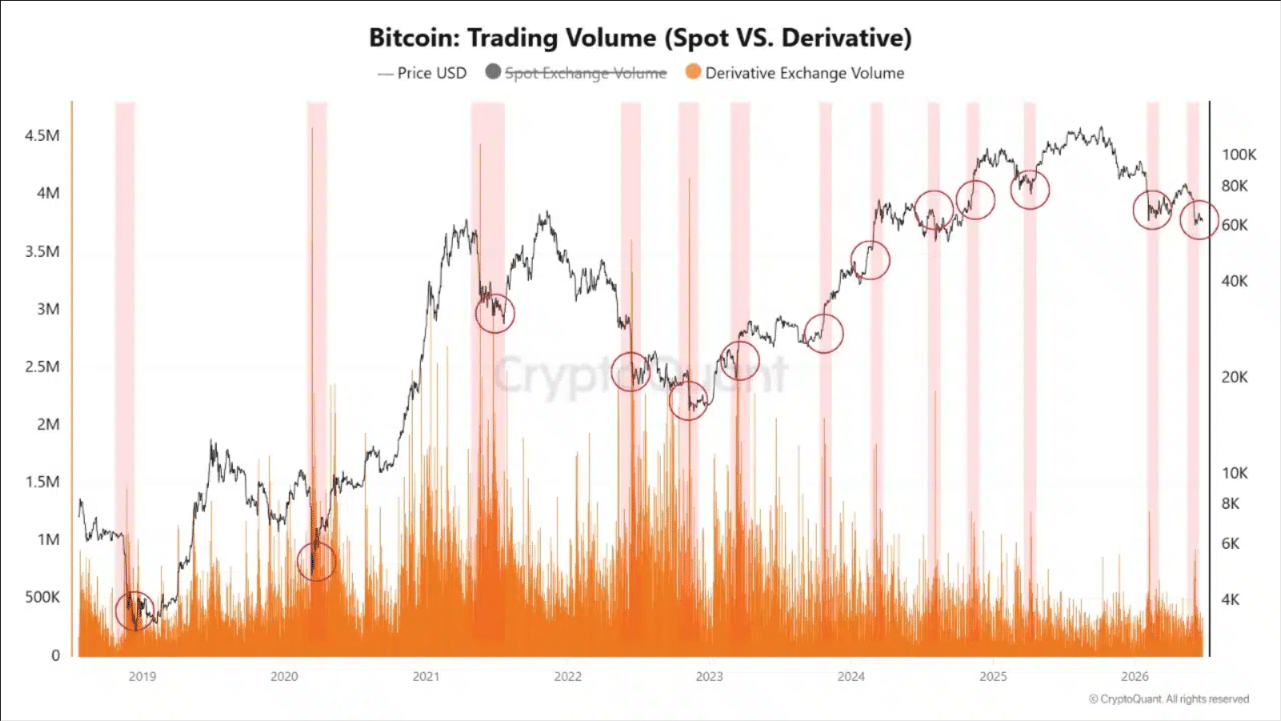
Spot Volume vs. Derivatives: Who Is Really Driving the Market
There is a structural shift worth noting in how Bitcoin price trades today compared to prior cycles. Historically, spikes in spot trading volume signaled genuine coin movement, whether large holders were accumulating quietly or distributing to retail at peak prices. Those volume bursts often appeared just before major price turning points, giving sharp-eyed analysts an early edge.
In the current cycle, derivatives activity has absorbed more of that role. Futures and options volumes are doing heavier lifting, which means the traditional spot volume signals carry slightly less predictive weight on their own. This is partly a function of institutional maturity. With spot Bitcoin ETFs now embedded in the market structure and accessible through standard brokerage accounts, large capital flows do not always show up where they once did.
That does not mean smart money has stepped back. It means the footprint looks different, and reading it correctly requires combining on-chain metrics with derivatives data rather than relying on either alone.
What Comes Next for Bitcoin
Bitcoin price is sitting at a crossroads that will likely resolve through spot flows, ETF activity, or a shift in derivatives positioning. The $59,000 to $60,000 zone is now the battleground, and how the market behaves here will shape the next several weeks of price action. A sustained hold could build a foundation for recovery. A break lower would test the conviction of those who view this as a healthy reset rather than the beginning of a deeper correction.
Conclusion
The Bitcoin price drop below $60,000 carries real weight, but the on-chain evidence suggests this is more of a market cooling off than a market breaking down. Lower open interest, moderating leverage, and active exchange netflows paint a picture of participants who are cautious and watchful rather than running for the exits. Whether this zone becomes a launchpad or a ledge will depend on how spot and derivatives flows evolve in the days ahead. For now, the data speaks a language of reset, not ruin.
Frequently Asked Questions
What caused Bitcoin price to fall below $60,000? A combination of short-term support failure at $63,000 and broader market pressure pushed Bitcoin to approximately $59,500, without a single identifiable trigger.
What does positive exchange netflow mean for Bitcoin? It means more Bitcoin is moving onto exchanges than leaving, which can signal that traders are preparing to sell, hedge, or actively trade rather than hold long-term.
Is lower open interest a good or bad sign? Lower OI generally reduces the risk of mass liquidations, which makes price declines less likely to spiral, making it a relatively stabilizing signal during a correction.
Glossary of Key Terms
Open Interest (OI): The total value of outstanding futures or options contracts in the market. Higher OI means more leveraged bets are open; lower OI indicates the market is less crowded with speculation.
Exchange Netflow: The net difference between Bitcoin flowing into and out of exchanges. Positive netflow means more is coming in than going out, which can precede volatility.
Spot Volume: The amount of actual Bitcoin being bought and sold directly, as opposed to through derivatives contracts.
Leverage: Borrowed capital used to amplify a trading position. High leverage increases both potential gains and the risk of rapid, forced liquidations.
Sources
cryptoquant
ambcrypto