How Far Has The Bitcoin Price Moved? $Bitcoin is trading at $84,374 after a sharp vertical move that started around 11:30 UTC. Previous close was $81,152, which puts BTC up roughly 4% on the
How Far Has The Bitcoin Price Moved?
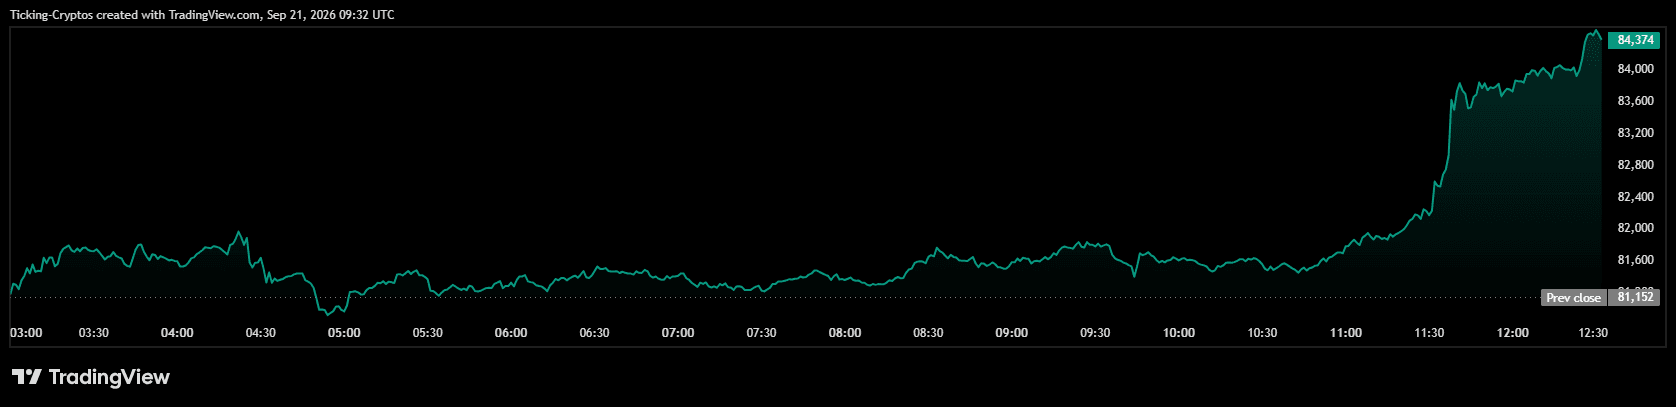
$Bitcoin is trading at $84,374 after a sharp vertical move that started around 11:30 UTC. Previous close was $81,152, which puts BTC up roughly 4% on the day and through a ceiling that had rejected buyers repeatedly since spring. Bitcoin peaked above $121,000 earlier in 2026 before grinding lower through the summer into the mid-$60,000s, so this is a recovery leg with real room above it, not a blow-off top.
BTC Chart in USD
Why Did Bitcoin Break Out Now?
The fuel was loaded on Friday. The Fed raised rates by 25 basis points, but the projected path was less hawkish than markets feared, which sent risk assets higher. $BTC jumped more than 6% and over $445 million in crypto shorts were wiped out, with more than $230 million of that in Bitcoin positions alone. That cleared out the bears sitting under the range. When price pushed into thin territory above $82,000 today, there was very little resistance left to absorb it.
Are ETF Buyers Backing The Bitcoin Rally?
Yes, and that is the difference between this move and a pure leverage squeeze. US spot Bitcoin ETFs pulled in $593 million across Thursday and Friday, fully reversing the outflows earlier in the week. Funding rates have stayed low, signalling spot-driven demand rather than overheated leverage. Real buyers, not just liquidated shorts.
Bitcoin Price Analysis: What Do The Charts Say About BTC?
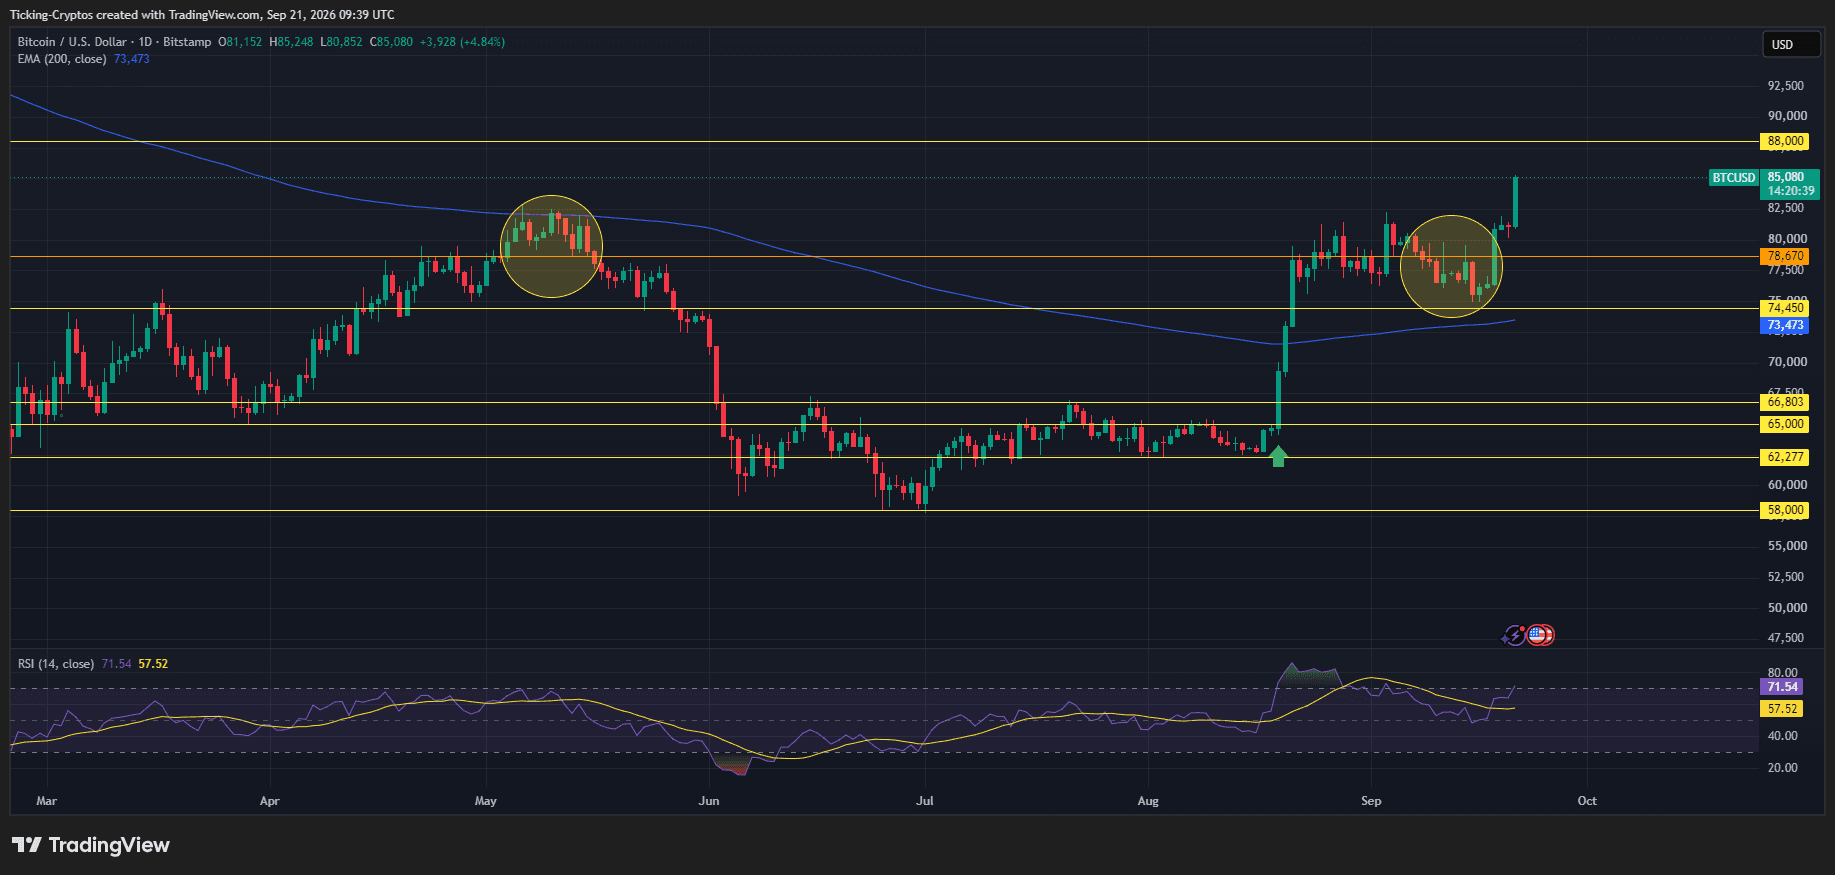
The technical picture flipped bullish before the breakout. Bitcoin's 50-day moving average crossed above its 200-day for the first time in 2026, the classic golden cross, and price reclaimed Glassnode's True Market Mean near $76,660 along with the corporate treasury cost basis around $80,421. Translation: the average corporate Bitcoin buyer is back in profit, which removes a wall of would-be sellers.
Bitcoin Price Prediction: What Is The Next Level For Bitcoin?
$85,000. Glassnode pegs that as the ETF cost basis, the average entry price of spot ETF buyers, and it is the last major overhead level before the market opens up. Analysts had flagged $84,100 and $85,000 as the key weekly obstacles, with sustained acceptance above $85,000 pointing toward $88,000 to $90,000. On the downside, losing $77,500 would undo the breakout.