Bitcoin has slipped below the crucial $70,000 level as bearish sentiment tightens its grip on the crypto market, with the price continuing to print lower highs and lower lows. The decline com
Bitcoin has slipped below the crucial $70,000 level as bearish sentiment tightens its grip on the crypto market, with the price continuing to print lower highs and lower lows. The decline comes amid more than $3 billion in institutional outflows over the past 20 days. Meanwhile, whale activity has surged to a six-week high, with transactions exceeding $100,000 reaching levels last seen in April 2022.
As the BTC price falls below $69,000 despite heightened whale participation, the current market structure suggests further downside pressure could be building in the days ahead.
Bitcoin Breaks the Bearish Flag, Second Time This Year
Bitcoin has delivered a decisive bearish breakdown after slipping below the lower trendline of a multi-month ascending parallel channel, signaling that bullish momentum is weakening. The latest drop has pushed BTC below the psychological $70,000 level, placing the crucial support zone around $69,000 under intense pressure. The chart shows Bitcoin respecting the ascending channel since February, before eventually breaking below the lower boundary
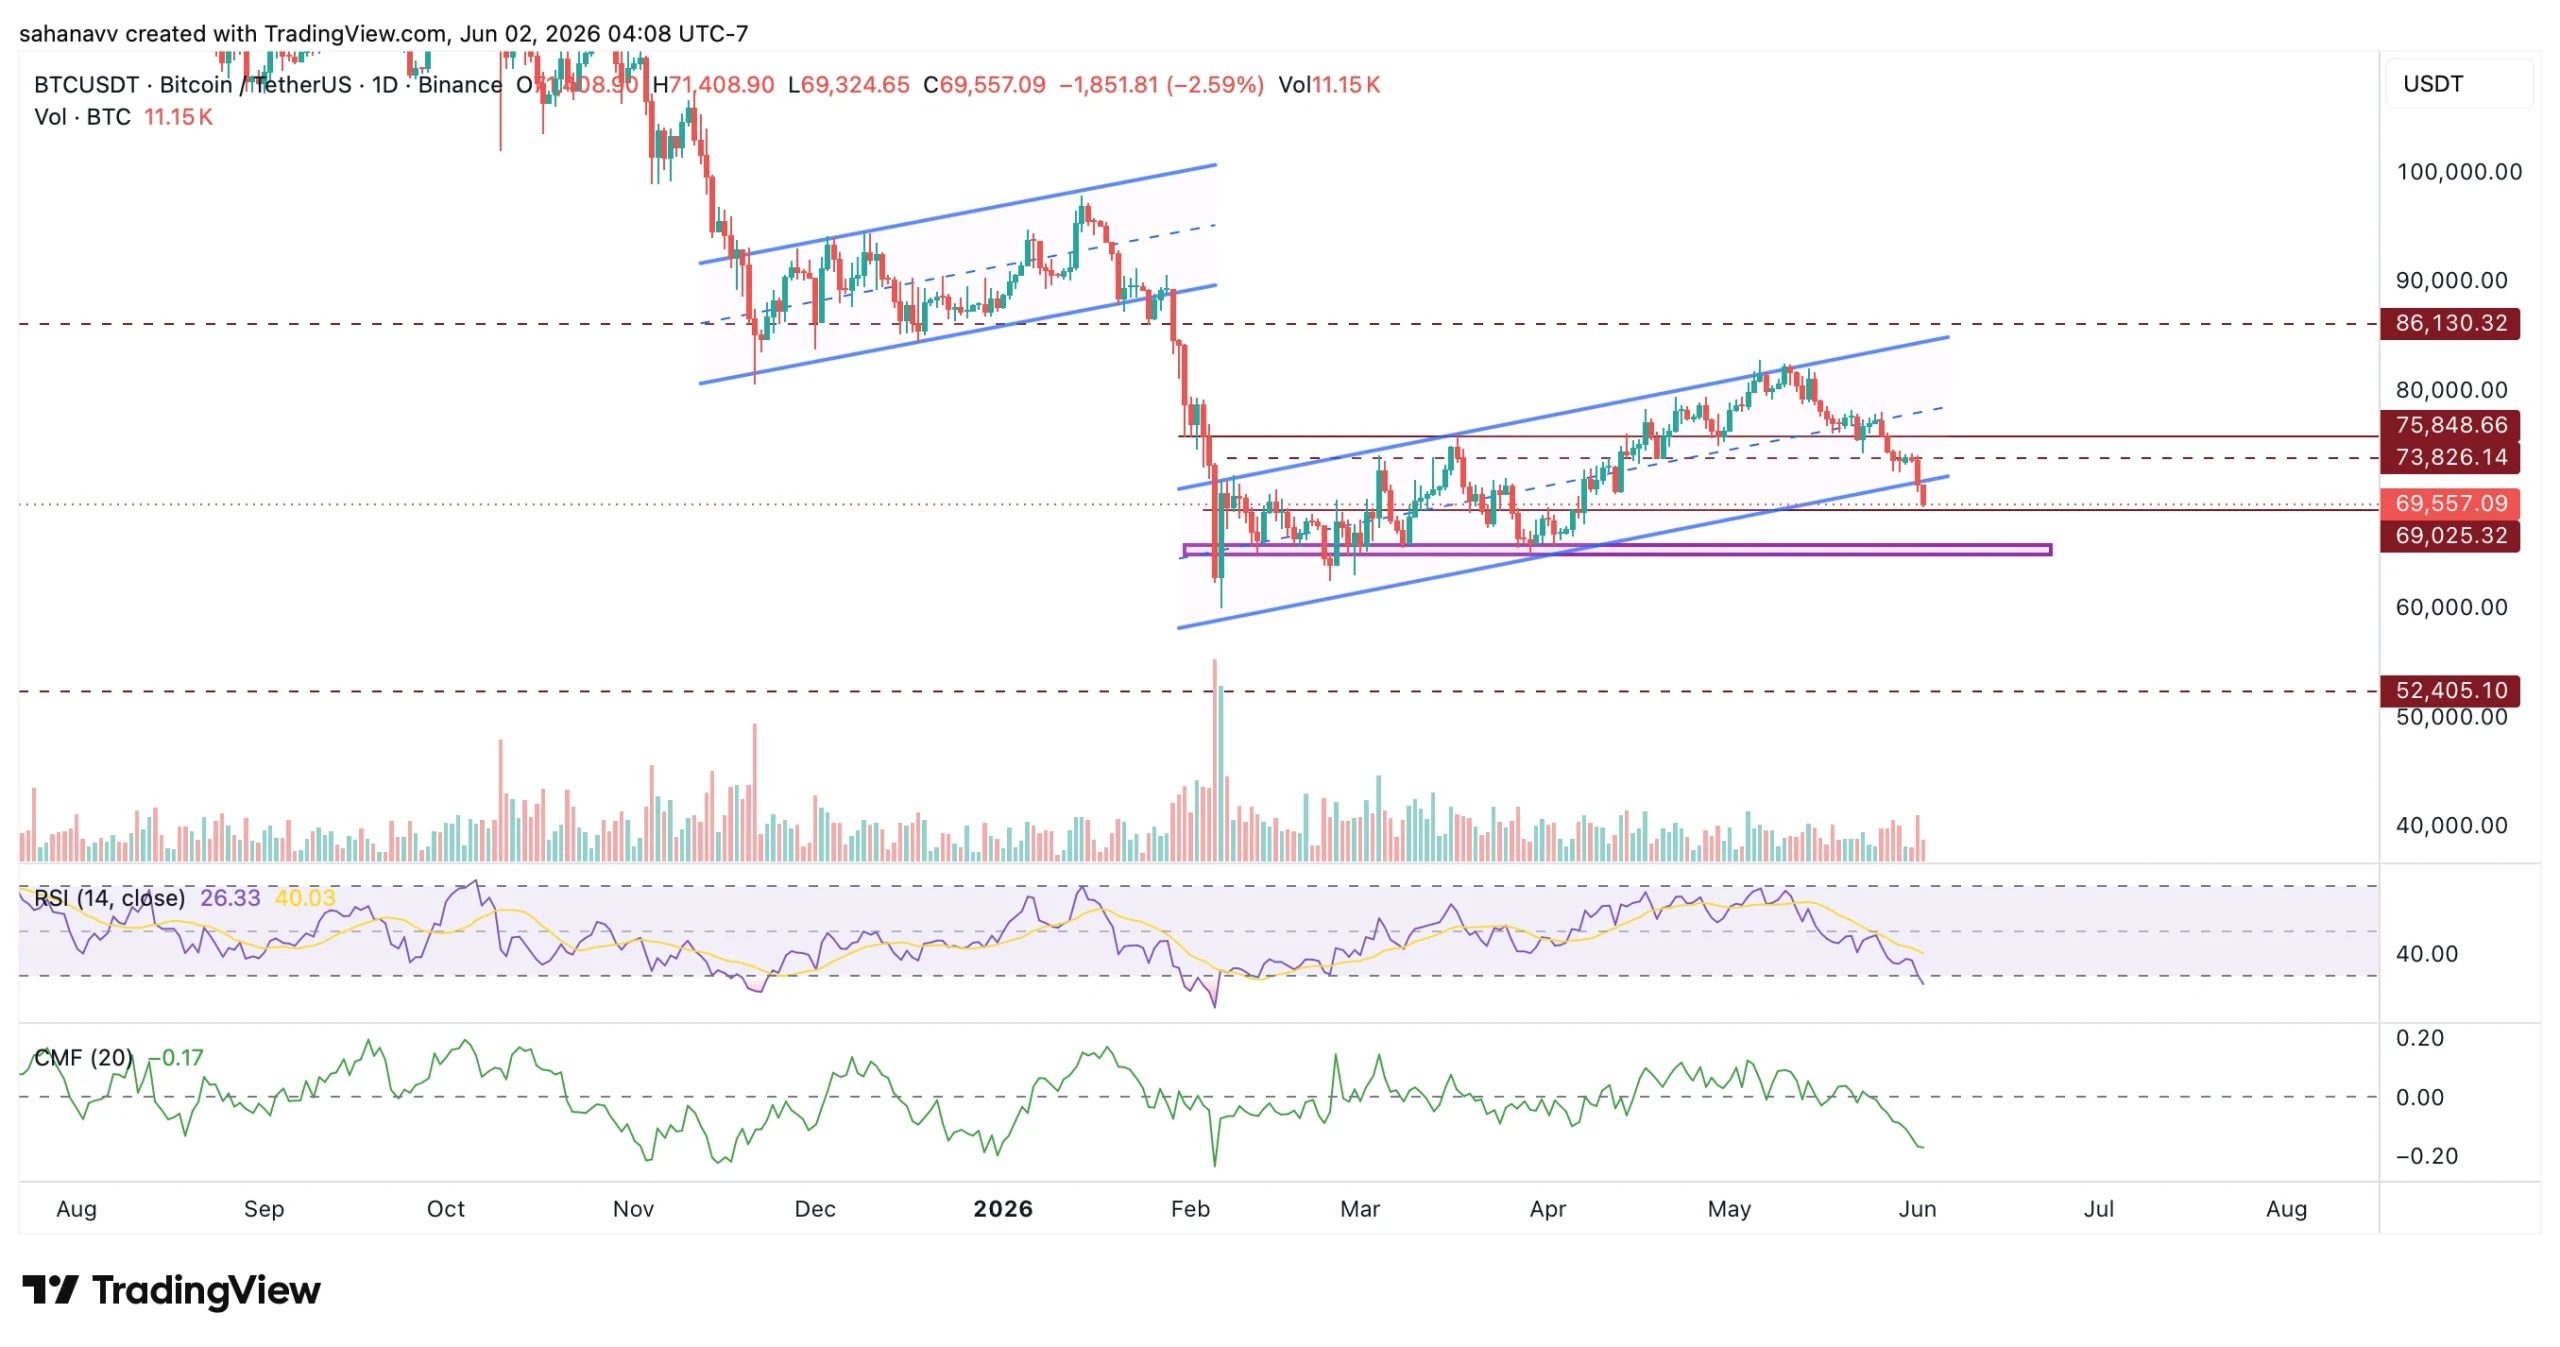
The Relative Strength Index (RSI) has plunged below 30, reaching oversold territory near 26. The Chaikin Money Flow (CMF) indicator has dropped below the zero line and continues trending lower. The combination of falling RSI, negative CMF, and a breakdown below channel support points to weakening buyer conviction and growing seller dominance.
Key Bitcoin Price Levels to Watch
Immediate Support: $69,000
Major Support Zone: $64,000–$65,000
Immediate Resistance: $73,800
Major Resistance: $75,800
Long-Term Resistance: $86,100
Bitcoin Price Prediction for June 2026
The breakdown below the ascending channel and loss of the $70,000 threshold suggest Bitcoin remains vulnerable to further downside. The $69,000 support zone now represents the most critical level for bulls to defend. A decisive breakdown below this area could open the door for a deeper correction toward the mid-$60,000 region.
However, if buyers manage to reclaim the lost channel support and push BTC back above $73,800, the bearish scenario could weaken significantly. Until then, the technical structure favors sellers, with downside risks outweighing bullish recovery signals.