Bitcoin Price Forecast: BTC Slides Below $64K as Whales Cash Out Bitcoin is under pressure again. The world's largest cryptocurrency slipped below $64,000 this week, dragged down by fresh geo
Bitcoin Price Forecast: BTC Slides Below $64K as Whales Cash Out
Bitcoin is under pressure again. The world's largest cryptocurrency slipped below $64,000 this week, dragged down by fresh geopolitical shocks and heavy whale selling.
Traders are now asking the same question on every crypto forum: is this the start of a deeper correction, or just a shakeout before the next leg up?
This Bitcoin price forecast looks at the latest on-chain data, whale activity, and macro headlines shaping BTC right now.
What is Bitcoin's price today?
$BTC traded at $63,381.2, down 1.92% on the day, according to CoinGlass data. That follows a slide from around $65,000 a day earlier.
BTC is also trading below its 50-day simple moving average. This is a level many traders watch closely for short-term momentum.
Metric
Value
BTC Price
$63,381.2
24h Change
-1.92% ($1,240.74)
Market Cap
$1.27T
Open Interest
$46.97B
Futures Volume (24h)
$50.41B
Circulating Supply
20.05M BTC
Why is Bitcoin price dropping today?
Two big headlines are weighing on Bitcoin and the wider risk-on market.
First, fresh US airstrikes hit targets in Iran. Fars News Agency reported strikes on five bridges in Hormozgan province on July 17. Iran's Chabahar maritime control tower was also reportedly hit.
Second, US President Trump declassified an intelligence report alleging Chinese interference in the 2020 election, claiming China obtained records on 220 million US voters. China's Embassy denied the claim.
Eamonn Sheridan, chief Asia-Pacific currency analyst at InvestingLive, said the new allegations against China add fresh friction risk just weeks before a planned September meeting between Trump and President Xi Jinping.
He noted the rhetoric alone could complicate diplomacy through September, regardless of the underlying facts.
Together, these events pushed investors toward caution, and Bitcoin, along with other risk assets, felt the impact.
Are Bitcoin whales selling right now?
Yes. During Bitcoin's recent rebound from $62,000 to $65,600, whale wallets holding between 10 and 1,000 BTC used the bounce to lock in profits.
Roughly 12,555 BTC were sold during that rally, based on data shared by Ali Charts on X.
The chart shows whale holdings sliding from around 9.53M BTC in December to 9.29M BTC by June, even as price climbed from roughly $64,684 toward higher levels over the same window.
This kind of selling into strength is common after sharp rallies. It does not always signal a trend reversal, but it does show larger holders taking chips off the table rather than adding.
How much has been liquidated in the crypto market?
Liquidations spiked hard in the past 24 hours. CoinGlass data shows 92,777 traders were liquidated, with total liquidations reaching $372.43 million.
The single largest liquidation order hit on Binance, an ETHUSDT position worth $6.57 million.
Timeframe
Long Liquidations
Short Liquidations
1h
$1.84M
$140.93K
4h
$15.44M
$628.19K
12h
$32.09M
$2.47M
24h
$56.98M
$15.60M
Long positions took the bigger hit across every timeframe, showing that traders betting on higher prices got caught out by the sudden drop.
Despite the selloff, $79.15 million in inflows was recorded yesterday, hinting that some buyers still see value at current levels.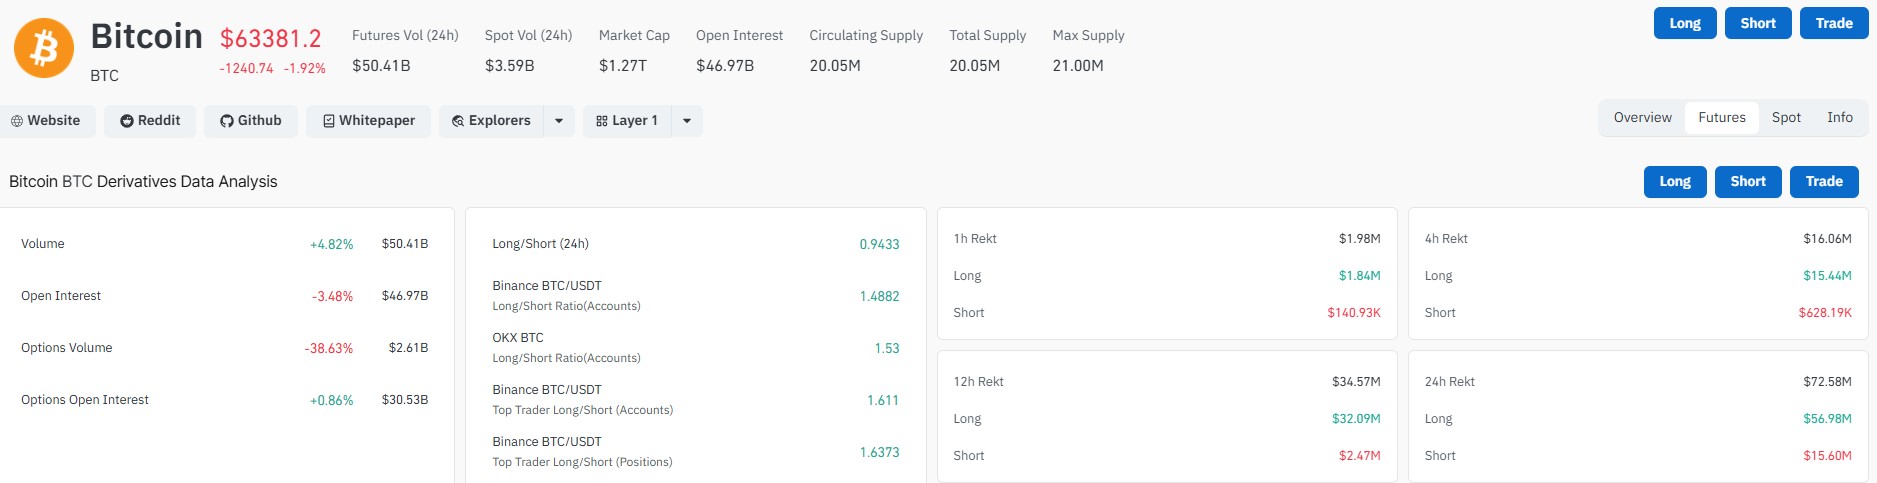
When could Bitcoin bottom, based on history?
Looking at Bitcoin's monthly chart, a historical pattern stands out. $BTC has bottomed roughly 12 months after each major market top in past cycles.
If that pattern repeats, the next market bottom could form around October, based on the cyclical structure visible on the BTC monthly chart shared by Ali Charts.
This is not a guarantee. Every cycle has unique conditions, and past patterns do not always repeat exactly. Still, many traders use this kind of historical mapping as one input among several when thinking about timing.
What are traders watching next?
Long/short ratios on major exchanges still lean bullish. Binance shows a long/short ratio of 1.4882, and OKX shows 1.53, meaning more accounts are positioned long than short.
Options open interest rose slightly, up 0.86% to $30.53 billion, even as options volume fell 38.63%. This suggests some traders are still hedging or positioning for volatility ahead.
Commentator Peter Schiff also pointed to weakness beyond crypto, noting that $SPCX closed near $131.11, below its IPO price, and that $NFLX fell 7% after hours.
He argued rising rates, war risk, and stretched valuations could pressure momentum assets broadly, adding that Bitcoin was the first bubble to pop.
Not everyone agrees with that framing, but it reflects one side of the current debate around risk assets.
Bitcoin Price Prediction: What Does the Daily Chart Show?
The BTC/USD daily chart shows the price is trading at $63,254, down 0.84% on the day. Price opened at $63,783 and touched a high of $64,008 before slipping to a low of $63,254.
EMA
Value
Price Position
EMA 20
$63,276
Price trading near this level
EMA 50
$64,972
Price below, acting as resistance
EMA 100
$68,275
Price well below
EMA 200
$74,286
Price well below, long-term downtrend
Price is trading below all four EMAs except the 20-EMA, which it is hovering right around. This shows Bitcoin remains in a short- to medium-term downtrend.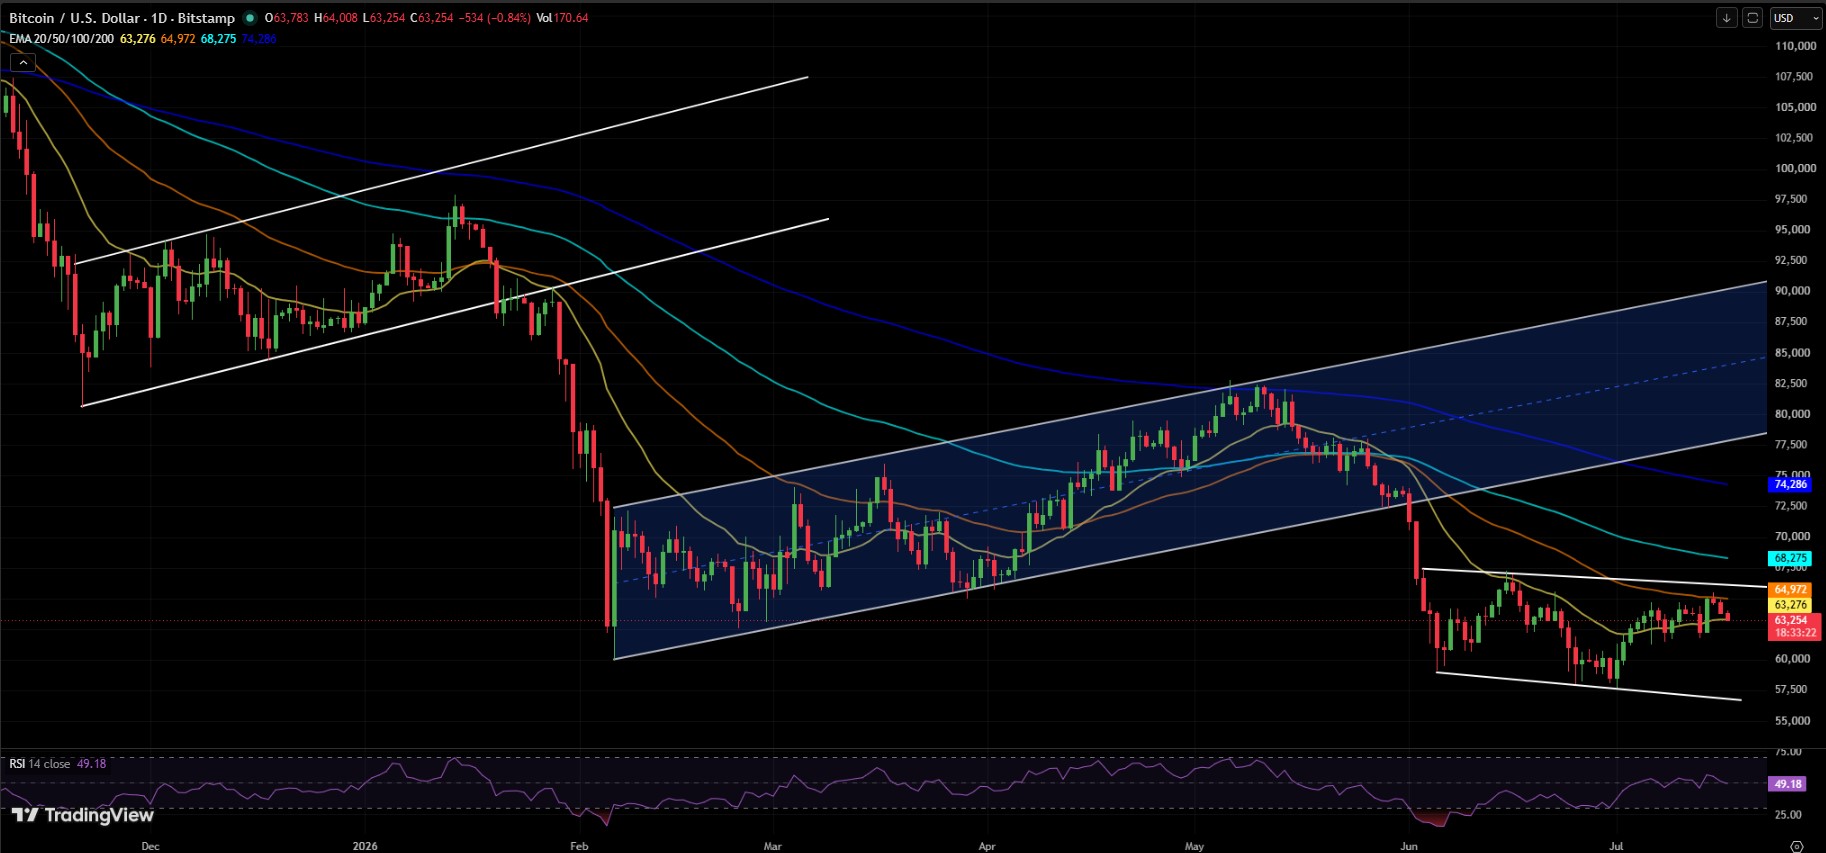
What does RSI say about Bitcoin right now?
The Relative Strength Index (RSI) sits at 49.18 on the daily chart. This is almost exactly at the midpoint of the 0-100 scale.
An RSI near 50 means $BTC is neither overbought nor oversold. It reflects the current sideways, indecisive price action rather than strong momentum in either direction.
What are the key support and resistance levels for BTC?
Looking at the daily chart, two levels stand out.
Support sits near $57,500 to $58,000, based on the lower trendline and recent swing lows.
Resistance is layered between $64,000 and $65,000, matching the upper channel and the EMA 50 level at $64,972.
A daily close above $65,000 could open the door toward the EMA 100 near $68,275.
A break below $58,000, on the other hand, could expose the structure to a deeper retest of the broader rising channel drawn from December's low.
Bitcoin Price Prediction: Short-Term Outlook
Based on the pattern, Bitcoin could see a technical bounce if it holds above the $60,000 to $61,000 zone, which has acted as a floor over the past several sessions.
A confirmed breakout above the upper trendline, combined with a daily close above the EMA 50 at $64,972, would be an early signal that buyers are regaining short-term control.
If Bitcoin instead breaks below the lower channel near $58,000, it would suggest sellers are back in charge, and a retest of the low-$50,000s range could follow.
For now, the pattern and a neutral RSI reading suggest Bitcoin is in a consolidation phase, waiting for a catalyst, whether from macro headlines or on-chain flows, to decide its next directional move.
Bitcoin Price Forecast: Key Takeaways
Bitcoin faces a mix of pressures right now. Whale profit-taking, geopolitical tension between the US and Iran, and renewed US-China friction are all weighing on sentiment.
At the same time, inflows continue, long positioning remains dominant, and historical cycle patterns point to a possible bottom later this year.
This Bitcoin price prediction remains open-ended. The next few weeks of macro headlines, paired with on-chain whale behavior, will likely decide whether BTC stabilizes or extends its slide.
Disclaimer
This article is for informational purposes only and does not constitute financial, investment, or trading advice. Cryptocurrency markets are highly volatile and involve significant risk. Always do your own research and consult a licensed financial advisor before making investment decisions.