Bitcoin price prediction watchers have a lot to chew on this week. BTC is trading near $65,305, down slightly on the day but still holding inside a well-defined rising channel it has followed
Bitcoin price prediction watchers have a lot to chew on this week. BTC is trading near $65,305, down slightly on the day but still holding inside a well-defined rising channel it has followed since June.
The move comes right after a small shake-up in the ETF market. After seven straight days of inflows, spot BTC ETFs saw an outflow of $225.18 million on July 23. It's a small dent, not a trend reversal, at least not yet.
What Is Bitcoin's Price Today?
BTC opened the day at $65,050 and touched a high of $65,412 before settling around $65,305, roughly flat on the session.
On the daily chart, price is riding an ascending channel that started forming after the sharp February selloff. The 20-day moving average sits at $64,261, with the upper Bollinger Band around $66,442 and the lower band near $62,081.
Price has bounced off the lower band a few times since May, which has kept the broader trend intact even through the sharp June dip toward $56,000.
The Relative Strength Index sits at 55.02 on the daily chart. That's a neutral reading, not overbought or oversold, which lines up with a market that's holding steady rather than trending hard in either direction.
Is Bitcoin Price Near a Key Support Level?
According to on-chain URPD data shared by analyst Ali Charts, Bitcoin has built a thick support shelf between $61,840 and $63,111.
More than 1.3 million BTC changed hands in that range, which tends to act like a floor during pullbacks.
Above the current price, there's reportedly no major resistance wall until $84,569, a zone where about 582,000 BTC previously traded.
That gap suggests price could move quickly if it breaks above recent highs, though nothing is guaranteed.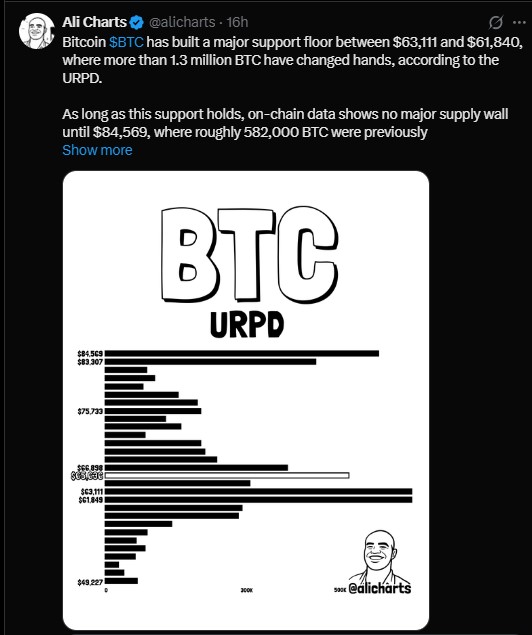
Is Now a Good Time to Buy Bitcoin?
The Sharpe ratio measures returns against risk. A positive number means gains have outpaced volatility. A negative one means investors have been through rough drawdowns.
Bitcoin's Sharpe ratio has dropped to -23, a level last seen near the bottoms of 2015, 2019, and 2022. Historically, these readings lined up with periods of heavy seller exhaustion rather than fresh crashes.
That doesn't mean a bounce is certain. But it does mark a point where downside momentum has often started fading in past cycles.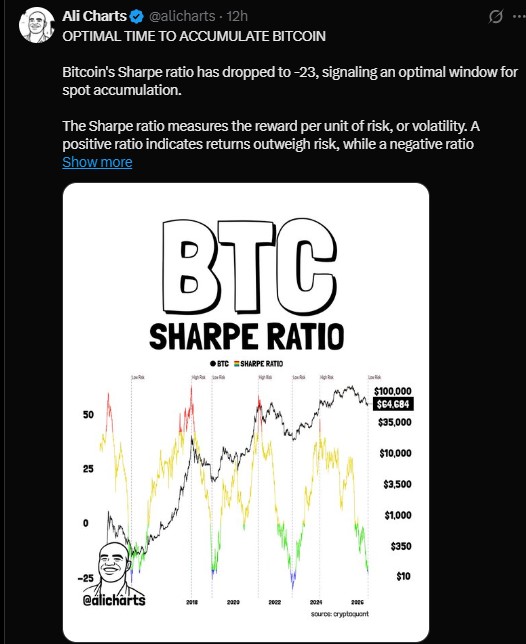
What Do Bitcoin Futures and Long/Short Data Show?
Metric
Value
Price
$65,303.80
24h Change
-0.5%
Market Cap
$1.30T
24h Futures Volume
$44.09B
Open Interest
$49.15B
Circulating Supply
20.06M BTC
Max Supply
21.00M BTC
Futures volume slipped 3.45% over the past day, while open interest also eased slightly by 0.60%. Options activity told a different story, jumping nearly 20% in volume.
Long/short data on Binance shows traders leaning long, with a ratio near 1.60 among top accounts. That's a mild bullish tilt, though crowded long positioning can sometimes set up sharp liquidation moves if price drops suddenly.
Rekt data shows $50.22 million in liquidations over 24 hours, split between $42.20M in longs and $8.03M in shorts, a sign some leveraged bulls got caught out during recent chop.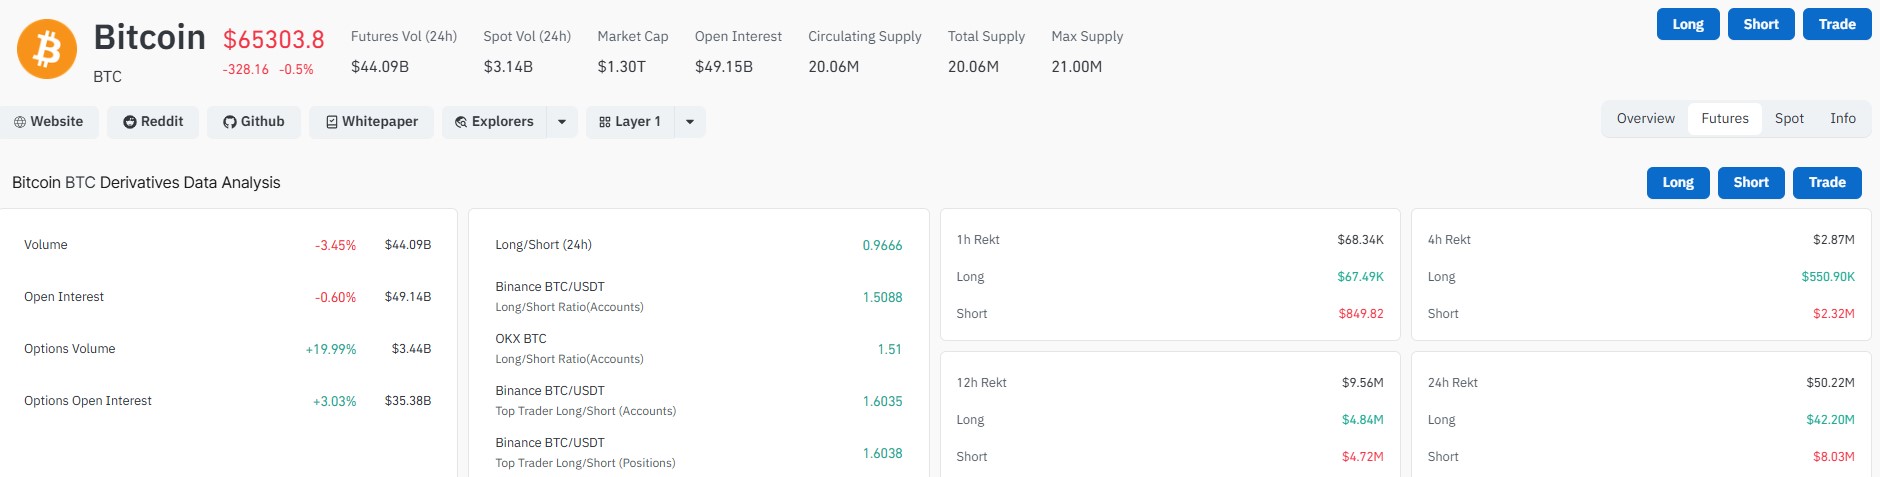
Are Bitcoin ETFs Seeing Inflows or Outflows Today?
Spot Bitcoin ETFs had logged inflows every day from July 14 through July 22, adding more than $600 million over that stretch. Then came the reversal.
Date
Daily Net Flow
Cumulative Net Inflow
Jul 23, 2026
-$225.18M
$51.63B
Jul 22, 2026
$68.99M
$51.85B
Jul 21, 2026
$203.14M
$51.78B
Jul 20, 2026
$226.92M
$51.58B
Jul 17, 2026
$132.30M
$51.35B
Total net assets sit around $78.82 billion. One red day after a strong run isn't unusual, and traders will be watching whether outflows continue this week or if buyers step back in.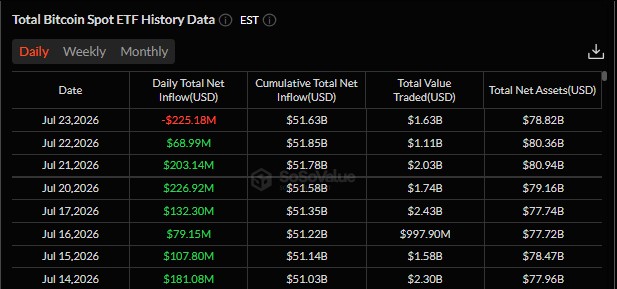
Where Is Bitcoin Price Headed Next?
Right now, Bitcoin sits in a tug of war. The ascending channel and heavy support near $62,000 to $63,000 argue for continued stability or a push higher.
At the same time, the fading ETF inflow streak and a recent rejection near the upper Bollinger Band show buyers aren't fully in control either.
A clean break above the mid-$66,000s could open the door toward $70,000 and eventually the $84,500 zone flagged by URPD data.
A drop back under $61,840 would put that support shelf to the test.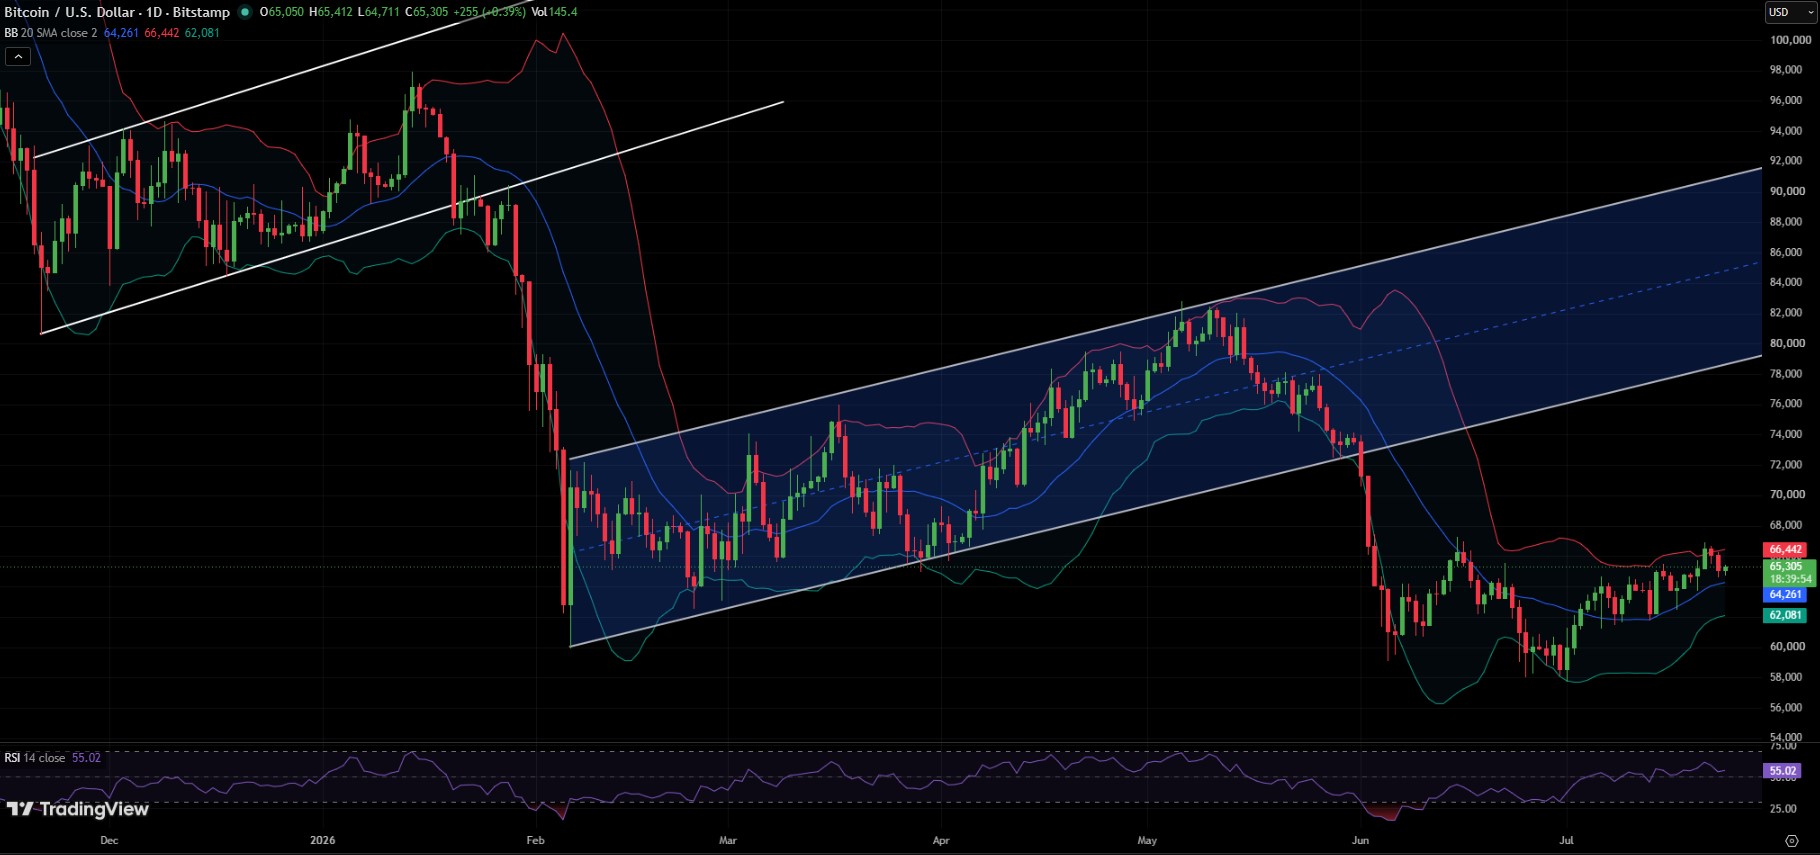
Either way, this Bitcoin price prediction points to a market that's coiled, not collapsing, with the next big move likely hinging on whether ETF demand picks back up.
Disclaimer
This article is for informational purposes only and does not constitute financial, investment, or trading advice. Cryptocurrency markets are highly volatile and unpredictable. Always do your own research and consult a licensed financial advisor before making any investment decisions.