Bitcoin is still trading below $65,000, changing hands near $64,903. It is up just 0.05% on the day, with a 24-hour range of $63,871 to $65,679. The market is waiting for U.S. retail sales da
Bitcoin is still trading below $65,000, changing hands near $64,903. It is up just 0.05% on the day, with a 24-hour range of $63,871 to $65,679.
The market is waiting for U.S. retail sales data and NVIDIA earnings. Both could move risk assets fast.
BTC sell-off hits stocks and gold too
Bitcoin is down roughly 18.7% over the past month. The S&P 500 has dropped 3.3%, and gold has fallen 7.9%, according to Santiment.
So this is not only a crypto story. The midterm outcome added doubt, and the NVIDIA fallout hit tech stocks hard. Crypto followed them lower.
Rising yields and a stronger dollar are adding pressure. Year-end tax selling may play a part too.
Whales keep selling BTC
Large holders sold or moved about 48,618 BTC over the past two weeks. That is worth around $3.40 billion.
Whale holdings dropped from about 13.73 million BTC to near 13.68 million BTC, based on Santiment data shared by Ali Charts. The selling has not stopped yet.
CryptoQuant also flags a problem. Apparent demand remains deeply negative, and the worry is that demand keeps failing to recover.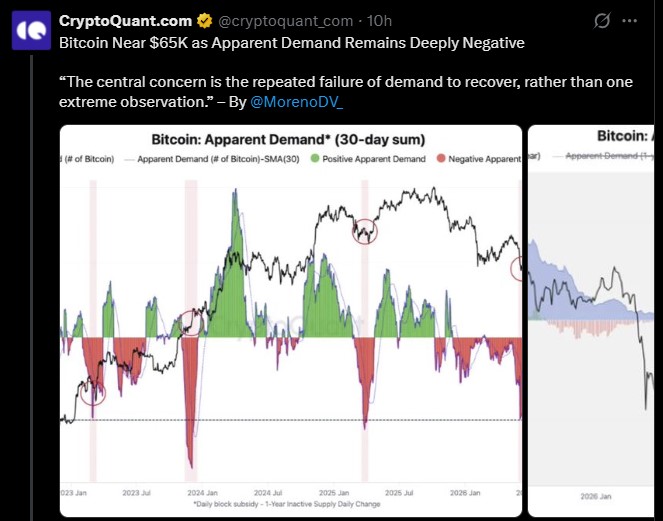
ETF outflows show weak short-term demand
US spot Bitcoin ETFs saw net outflows of $68.51 million on November 16. GBTC led with $34.59 million, followed by FBTC at $11.30 million and BTC at $6.61 million.
Cumulative net inflows still stand at $54.56 billion. Total net assets are about $84.32 billion, or 2.32% of BTC's market cap.
Long-term money is still there. Short-term demand looks softer.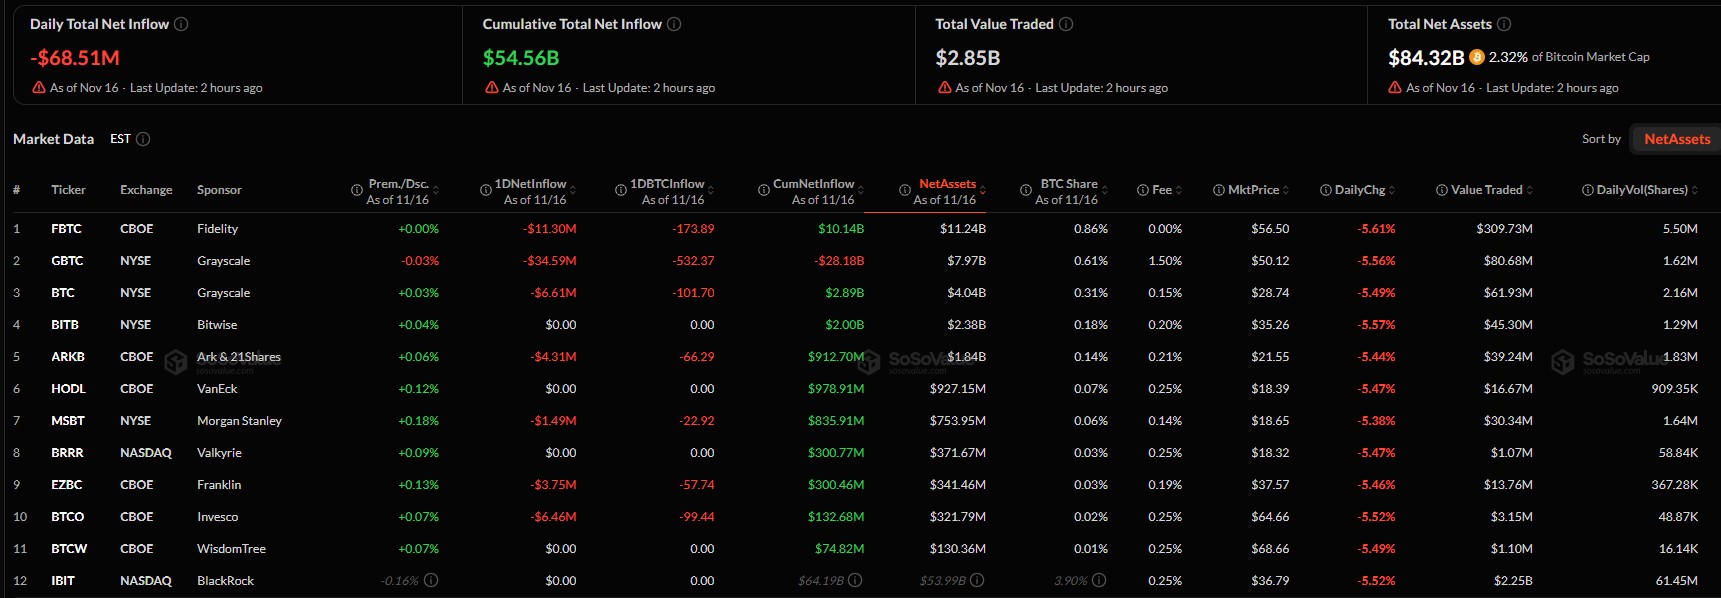
Futures data shows no clear direction
Open Interest rose 1.17% to $42.45 billion. Futures volume jumped 15.29% to $63.07 billion.
The funding rate is 0.0059%, so longs pay only a small cost. Total liquidations reached $91.59 million, with $57.84 million from shorts and $33.75 million from longs.
The Fear & Greed Index reads 12, which is extreme fear. Long/short ratios differ across exchanges, so traders are split.
BTC price forecast: $63K trendline decides the next move
On the weekly chart, $BTC was rejected near the $85,000 to $87,000 zone. Price now sits below the 20, 50, 100 and 200 EMAs.
Weekly RSI is near 38, under the neutral 50 line. That points to weak momentum.
BTC is testing an ascending trendline near $63,000 to $65,000. Price has not yet reclaimed $65,000, which keeps the short-term bias cautious.
Level
Price
Why it matters
Support 2
$55,000
Next target if $60,000 breaks
Support 1
$60,000
First stop below the trendline
Trendline support
$63,000 to $65,000
Weekly close below $63,000 is bearish
Current price
$64,903
Still below $65,000
Resistance 1
$69,600
First recovery target
200 EMA (weekly)
$69,646
Major trend filter
STH cost basis
$74.7K
Bulls need a daily close above it
Resistance 2
$74,500 to $78,300
Cluster of 20, 50 and 100 EMAs
If the trendline holds, a bounce toward $69,600 and then $74,500 to $78,300 is possible. A weekly close under $63,000 could open a drop to $60,000 and $55,000.
Until BTC closes a day above $74.7K, bears keep the upper hand.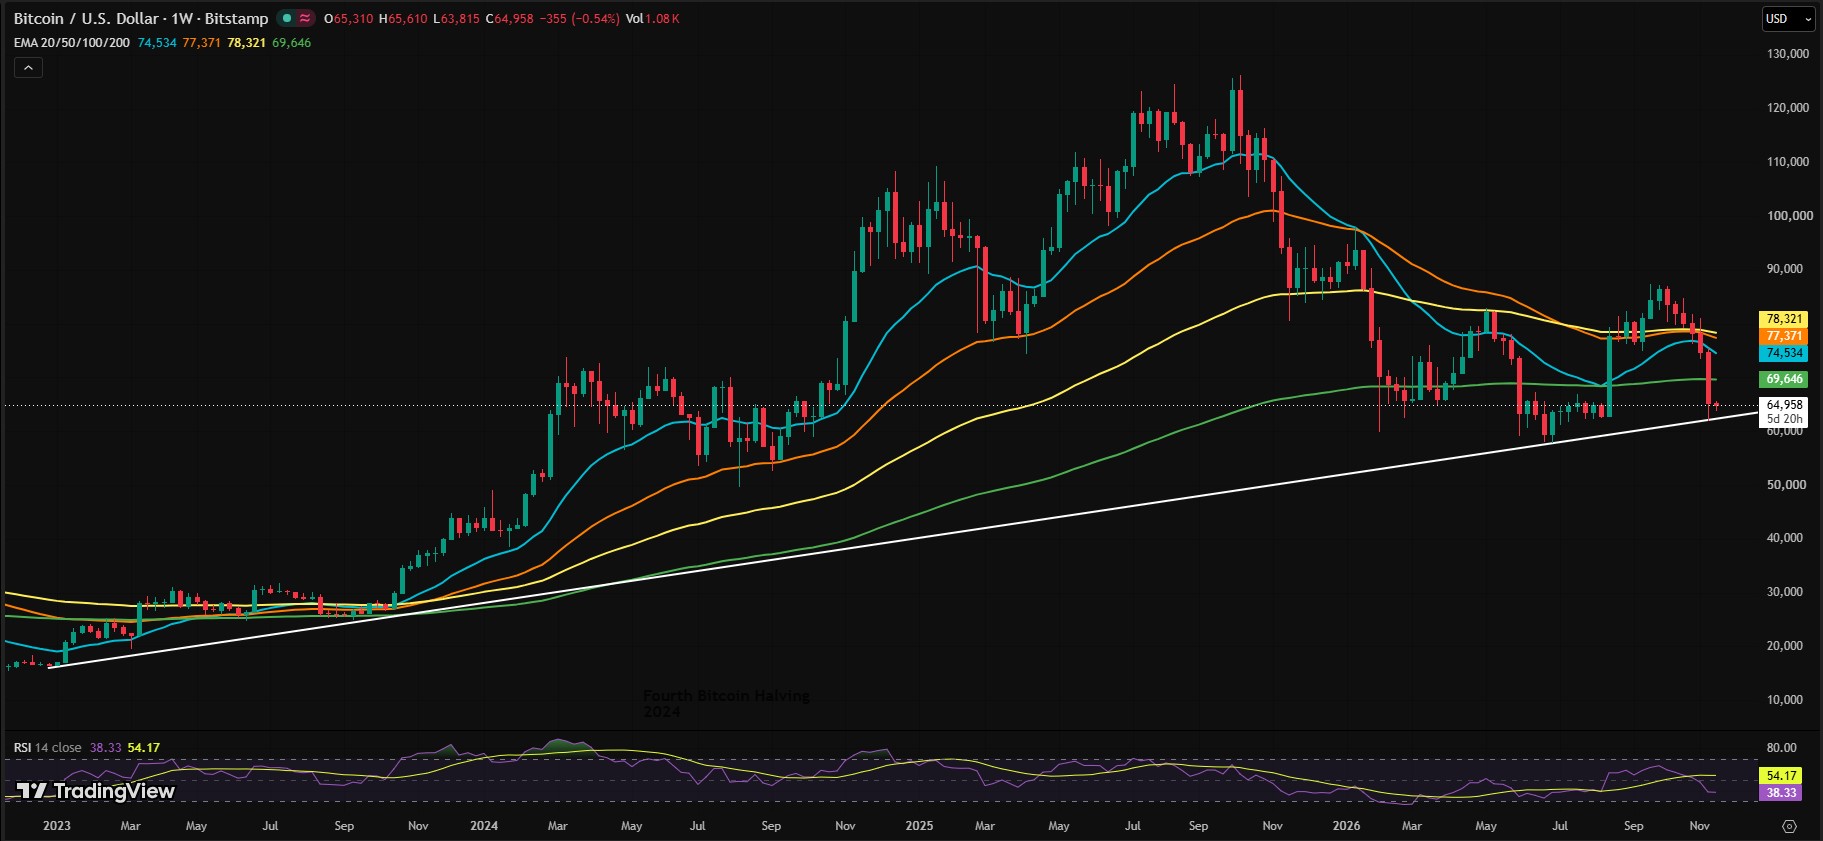
One data point gives bulls some hope. Historically, when the MVRV ratio fell below 1.2, it has signaled a forming market bottom.
Analyst Michael van de Poppe floated a surprise path. He said it would be funny if Bitcoin moves sideways, touches $75,000 to $78,000, retests lower, and then chops for eight weeks before a big run to $90,000 or higher.
That is one view, not a forecast anyone can count on. Fear has marked turning points before. It has also come before more downside.
For now, the $63,000 trendline decides the next move.
Disclaimer
This article is for information only and is not financial advice. Cryptocurrency prices are highly volatile, and you can lose some or all of your capital. Price levels and forecasts are not guaranteed. Always do your own research and speak to a licensed financial advisor before making any investment decision.