Bitcoin trades near $84,400 as of September 27, 2026, 18:38 UTC. Daily charts show a descending channel, while the monthly structure points to anascending channel still intact. This bitcoin p
Bitcoin trades near $84,400 as of September 27, 2026, 18:38 UTC. Daily charts show a descending channel, while the monthly structure points to anascending channel still intact. This bitcoin price prediction covers the next seven days and the 2026 outlook, with ETF demand as the biggest catalyst and a break below $74,968 as the biggest risk.
Bitcoin Price Prediction at a Glance
BTC Current Price
BTC sits at $84,373, up roughly 0.5% over 24 hours, per CoinMarketCap data. Seven-day gains run near 3.85%. Market cap holds at $1.69 trillion, while volume fell over 54%, part ofwhy BTC price moved sideways.
BTC Forecast Snapshot
Metric
Current View
Trend
Neutral, tilting bullish
Next Target
$91,792
Support
$74,968
Resistance
$91,792
RSI (Daily)
64.91
Bull Case
$126,200+
Base Case
$91,792 to $100,000
Bear Case
$64,015
Invalidation
Daily close below $74,968
BTC Price Prediction for the Next 7 Days
Price coils inside a descending channel on the daily chart. Immediate support holds at $84,257, resistance at $91,792, and the first Fibonacci extension.
BTC Bullish Scenario
If BTC clears $91,792 on real volume, $100,000 becomes the next target, and then $109,748 fast after that short squeeze setup traders are already watching.
$BTC Bearish Scenario
If $74,968 breaks, the $64,533 to $64,015 band becomes the target. That zone has held twice this cycle.
$BTC Technical Analysis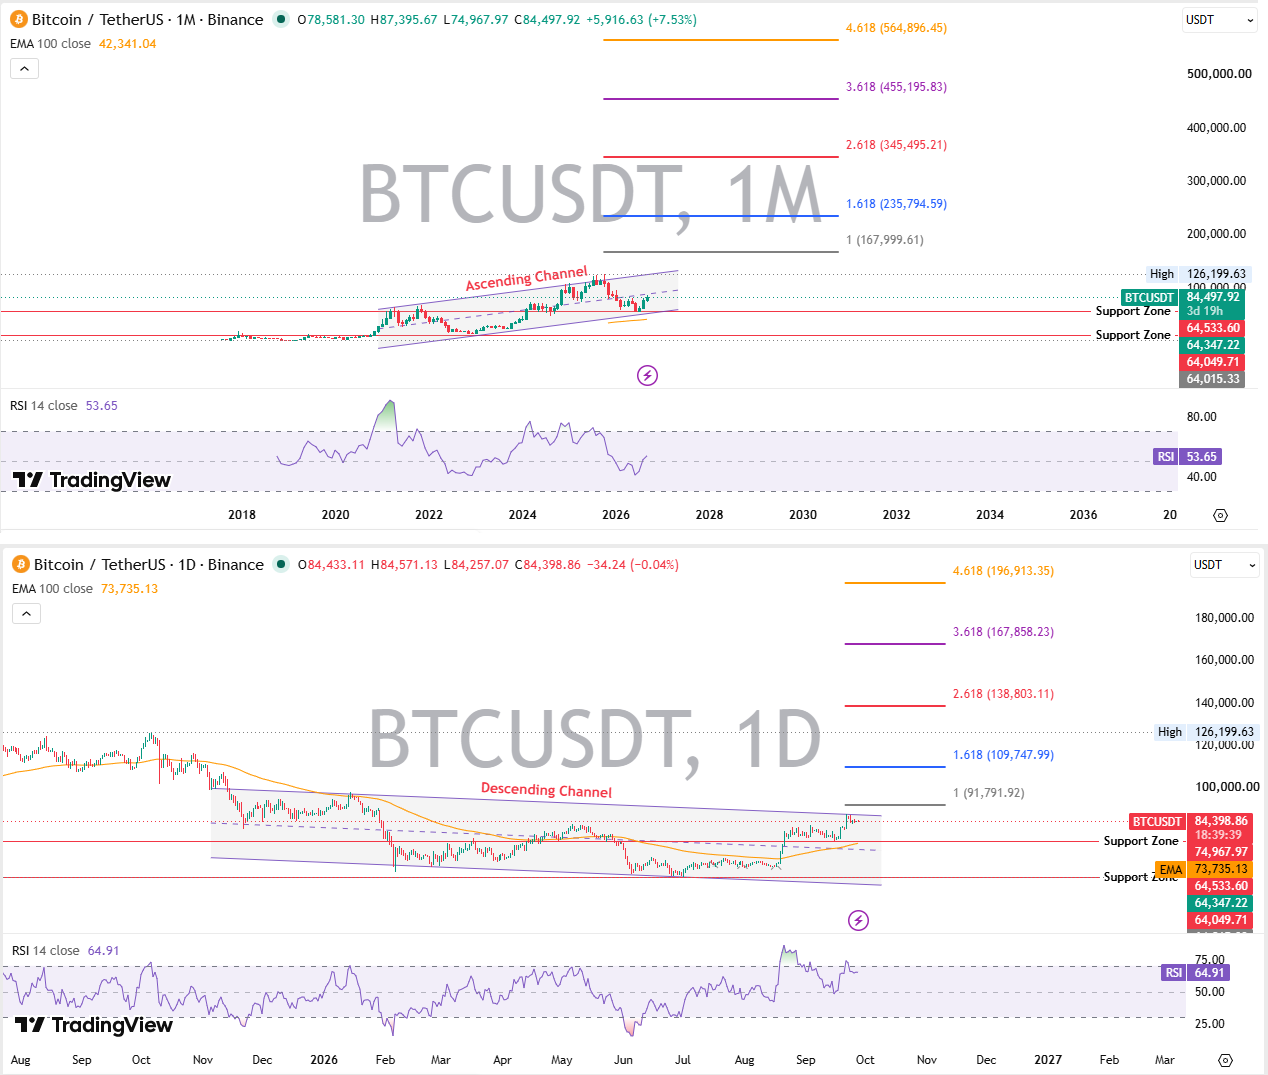
BTC Trend Analysis
Short-term trades stay choppy inside the descending channel. But the monthlyascending channel from the 2022 low remains intact, and the weekly structure mirrors that tug-of-war.
$BTC Support Levels
S1 sits at $74,968. S2 sits at $64,533. S3 sits at $64,015.
$BTC Resistance Levels
R1 sits at $91,792. R2 sits at $109,748. R3 sits at $126,200, the all-time high from October 2025.
RSI Analysis
Daily RSI reads 64.91, firm but not overbought. Monthly RSI reads only 53.65. Turns out, that leaves room before momentum stretches either way.
MACD Analysis
Daily MACD sits above signal, 2,433 versus 2,217. Monthly MACD stays below signal, a lag from the 2025 correction.
Volume Analysis
Basically, the bounce lacks strong confirmation. Binance alone carries over $625 million of spot turnover.
Breakout and Breakdown Levels
A breakout above $91,792 opens the door to $109,748. A breakdown below $74,968 opens the $64,000 band.
$BTC Bull, Base, and Bear Case
Scenario
Probability
Target
Market Cap
Trigger
Invalidation
Bear
25%
$64,015
$1.29T
Loss of $74,968 support
Reclaim above $84,000
Base
45%
$91,792 to $100,000
$1.85T to $2.01T
Range consolidation continues
Break of either boundary
Bull
30%
$126,200+
$2.54T+
Close above $91,792 on volume
Failure to hold $84,000
What Could Drive $BTC Higher?
ETF Demand
Spot bitcoin ETFs logged $134.47 million in net inflows on September 25, 2026, 00:00 UTC, per SoSoValue tracking, marking seven straight days of inflows near $2.97 billion.
Institutional Adoption
Strategy now holds 846,000 BTC, Strive 26,355 BTC, after both added 2,305 BTC this week, perBitcoin News. Public firms combined hold 1.273 million BTC, and Michael Saylor called MSTR digital equity on X.
Liquidity and Interest Rates
Treasury bond repurchases have helped risk appetite. AndOctober seasonality has favored bitcoin in 10 of the last 13 years.
BTC Supply and Halving Cycle
Circulating supply sits at 20.08 million of the 21 million max, a scarcity thatbeginner investors often underestimate.
Regulatory Developments
A White House official said there's a "pretty good chance" a Strategic Bitcoin Reserve becomes law, feedinglong-term price path scenarios beyond 2026.
What Could Push $BTC Lower?
Macro Risk
Bitcoin's year-to-date return sits at negative 3.60%, tied to the samebroader crypto market drivers as the wider risk complex.
ETF Outflows
September 15 saw an outflow near $450 million; proof flows can reverse.
Leverage and Liquidations
Open interest sits near $75.34 billion, down 1.28%. Liquidations over 24 hours totaled $8.92 million, per CoinGlass data, with funding low at 0.0027%.
Key Support Failure
A daily close below $74,968 flips the structure bearish fast.
Risk-Off Sentiment
Risk-off moves in equities or bonds tend to drag crypto lower first.
$BTC On-Chain and Market Data
Active addresses fell to 449,000, down 13.7%, while network fees dropped 36.1%. Transactions rose 26.5% to 757,000, and hash rate held near 1,016.3 EH/s, provinghow transaction validation works keeps scaling. Here's the thing: fewer addresses, more transactions, points to larger players, not retail returns.
Bitcoin Price Prediction 2026
Bear case: $64,015, if support fails.
Base case: $91,792 to $100,000, continued consolidation as ETF demand absorbs supply.
Bull case: $126,200 and beyond, if the reserve bill advances, part of the site'sbroader price prediction coverage. Invalidation sits below $64,015.
Bitcoin Price Prediction 2027-2030
Year
Bear
Base
Bull
Market Cap Range
Main Driver
2027
$64,015
$109,748
$167,858
$1.29T to $3.39T
Market cycle
2028
$74,968
$167,999
$235,795
$1.52T to $4.79T
Halving
2029
$91,792
$235,795
$345,495
$1.87T to $7.05T
Cycle expansion
2030
$109,748
$345,495
$564,896
$2.25T to $11.58T
Adoption and liquidity
Market cap figures assume circulating supply climbing gradually from 20.08 million toward 20.5 million BTC as the 2028 halving slows new issuance further.
How This Bitcoin Price Prediction Works
The framework blends market structure, multi-timeframe technicals, on-chain data, derivatives, ETF flows, macro backdrop, and growingBitcoin DeFi activity, then weights each scenario with a clear invalidation level.
Can $BTC Reach $100,000?
Yes, and not much. A break above $91,792 on real volume, alongside risingbitcoin dominance trends, puts $100,000 within reach. At $100,000, market cap works out near $2.01 trillion on current circulating supply.
Can Bitcoin Reach $150,000?
Possibly, but not on the current setup alone. It needs the reserve bill to pass and inflows to compound through 2027 and 2028. That level implies a market cap near $3.03 trillion, well above bitcoin's current $1.69 trillion.
Can $BTC Reach $1 Million?
Unlikely on any near-term timeline. That needs structural shifts far beyond current demand. A $1 million price would imply a market cap near $20.60 trillion, larger than gold's entire above-ground value today. Worth watching. Not worth pricing in yet.
$BTC Price Prediction Risks
Every forecast here stays probabilistic, not certain. Macro conditions can shift without warning, and technical levels can fail. Unexpected regulatory events, tracked inlatest crypto news updates, can invalidate any scenario above.
$BTC Trader Takeaway
Above $91,792: the bullish structure stays intact. Between $74,968 and $91,792: the range continues. Below $74,968: bearish invalidation, opening $64,533. Above $109,748: the next target near $126,200 becomes relevant.
Disclaimer: This article is for informational purposes only, not financial or trading advice. Crypto markets stay highly volatile, and past performance never guarantees future results. Readers should do independent research before making investment decisions.