Bitcoin has held above $63,000 after last week’s macro-driven rebound, but traders are now weighing expectations of Federal Reserve rate cuts against rising geopolitical tensions and mounting
Bitcoin has held above $63,000 after last week’s macro-driven rebound, but traders are now weighing expectations of Federal Reserve rate cuts against rising geopolitical tensions and mounting technical resistance.
Summary
- Bitcoin holds above $63K as traders await Fed minutes after a 10% macro-driven rebound.
- Technical indicators show strong support near $61K, but resistance remains firm around $64K-$65K.
- Rising oil prices and Strait of Hormuz tensions add fresh uncertainty to Bitcoin’s near-term outlook.
According to data from crypto.news, Bitcoin (BTC) price traded around $63,100 on Tuesday after briefly testing the $64,000 region again, leaving the market caught between bullish macro expectations and a growing list of near-term risks.
The cryptocurrency rallied nearly 10% over the past week after Federal Reserve Chair Kevin Warsh suggested artificial intelligence-driven productivity gains could help contain inflation, while a weak U.S. jobs report showing only 57,000 new payroll additions sharply increased expectations for interest-rate cuts. Lower borrowing costs typically improve liquidity conditions and have pushed investors back toward risk assets.
Recent gains have also coincided with renewed ETF demand. U.S. spot Bitcoin ETFs recorded two straight sessions of net inflows after weeks of persistent withdrawals, offering the first sign that institutional investors are cautiously returning to the market following June’s record $4.5 billion in net outflows.
You might also like: MiCA-compliant euro stablecoins jump 128% before EU deadline
Corporate treasury activity has also added volatility. Strategy disclosed an $8.32 billion second-quarter loss tied to its Bitcoin holdings and sold 3,588 BTC, triggering a sharp pullback toward the $61,000 area before buyers stepped back in. The decline liquidated nearly $500 million worth of leveraged long positions within 24 hours before prices recovered above $63,000.
Bitcoin faces heavy resistance while derivatives traders await the next catalyst
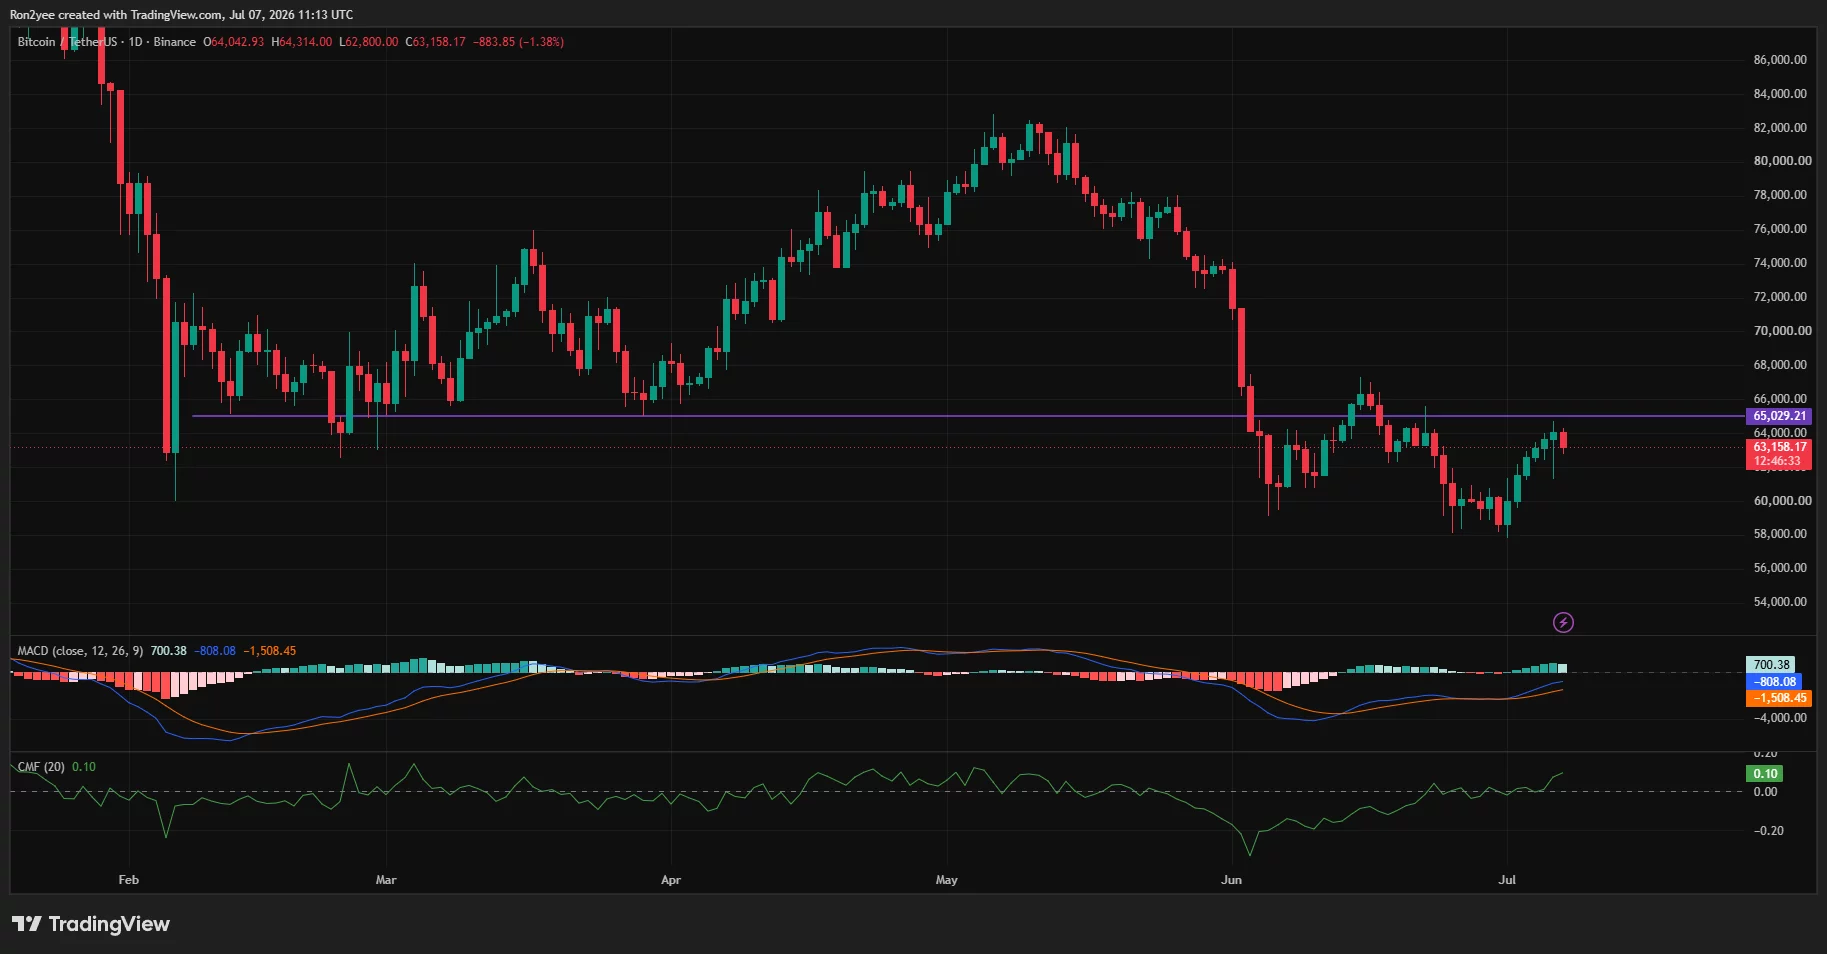
The daily chart shows Bitcoin rebounding strongly from the $58,000 area but failing to reclaim the key horizontal resistance near $65,000. Price remains below the 50-day moving average around $65,800, while the 200-day moving average continues to cap the longer-term trend.
Bitcoin daily price chart — July 7 | Source:
crypto.newsHowever, the Chaikin Money Flow has climbed back above zero, suggesting fresh capital has started returning after weeks of persistent selling. The MACD also remains in bullish territory, although upward momentum has slowed as price approaches resistance.
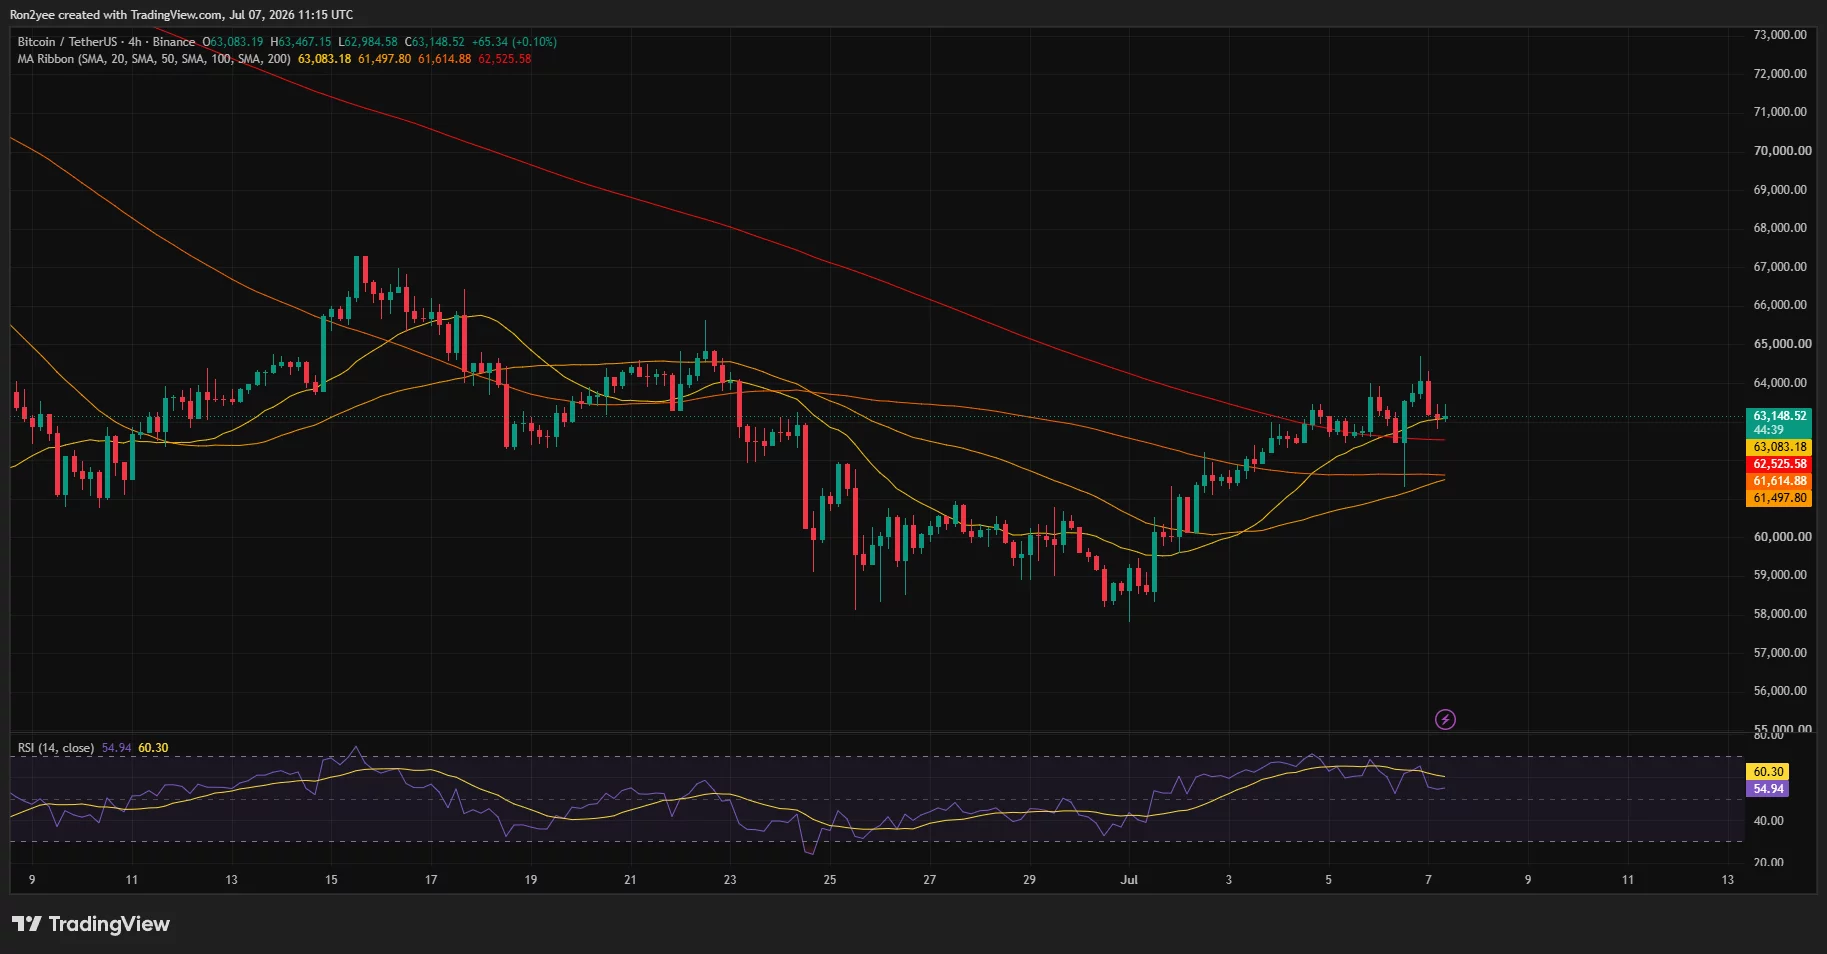
The 4-hour chart presents a more cautious picture. Bitcoin continues trading above its 20, 50 and 100-period moving averages, which currently converge between roughly $61,500 and $63,000 and provide layered support. Meanwhile, the Relative Strength Index has formed a bearish divergence, with price printing higher highs while RSI posts lower highs, often an early warning that buying momentum is weakening.
Bitcoin 4-hour price chart — July 7 | Source:
crypto.newsCommenting on the setup, analyst Daan Crypto Trades wrote:
“BTC Testing that ~$64K resistance area again, still trading below the 50EMA at $65.8K. FOMC minutes drop tomorrow which could easily be the catalyst for a move out of this price range.”
He added that a close above $64,000 could reopen the path toward the 50-day moving average, while approximately $60,700 remains the key support level for bulls to defend.
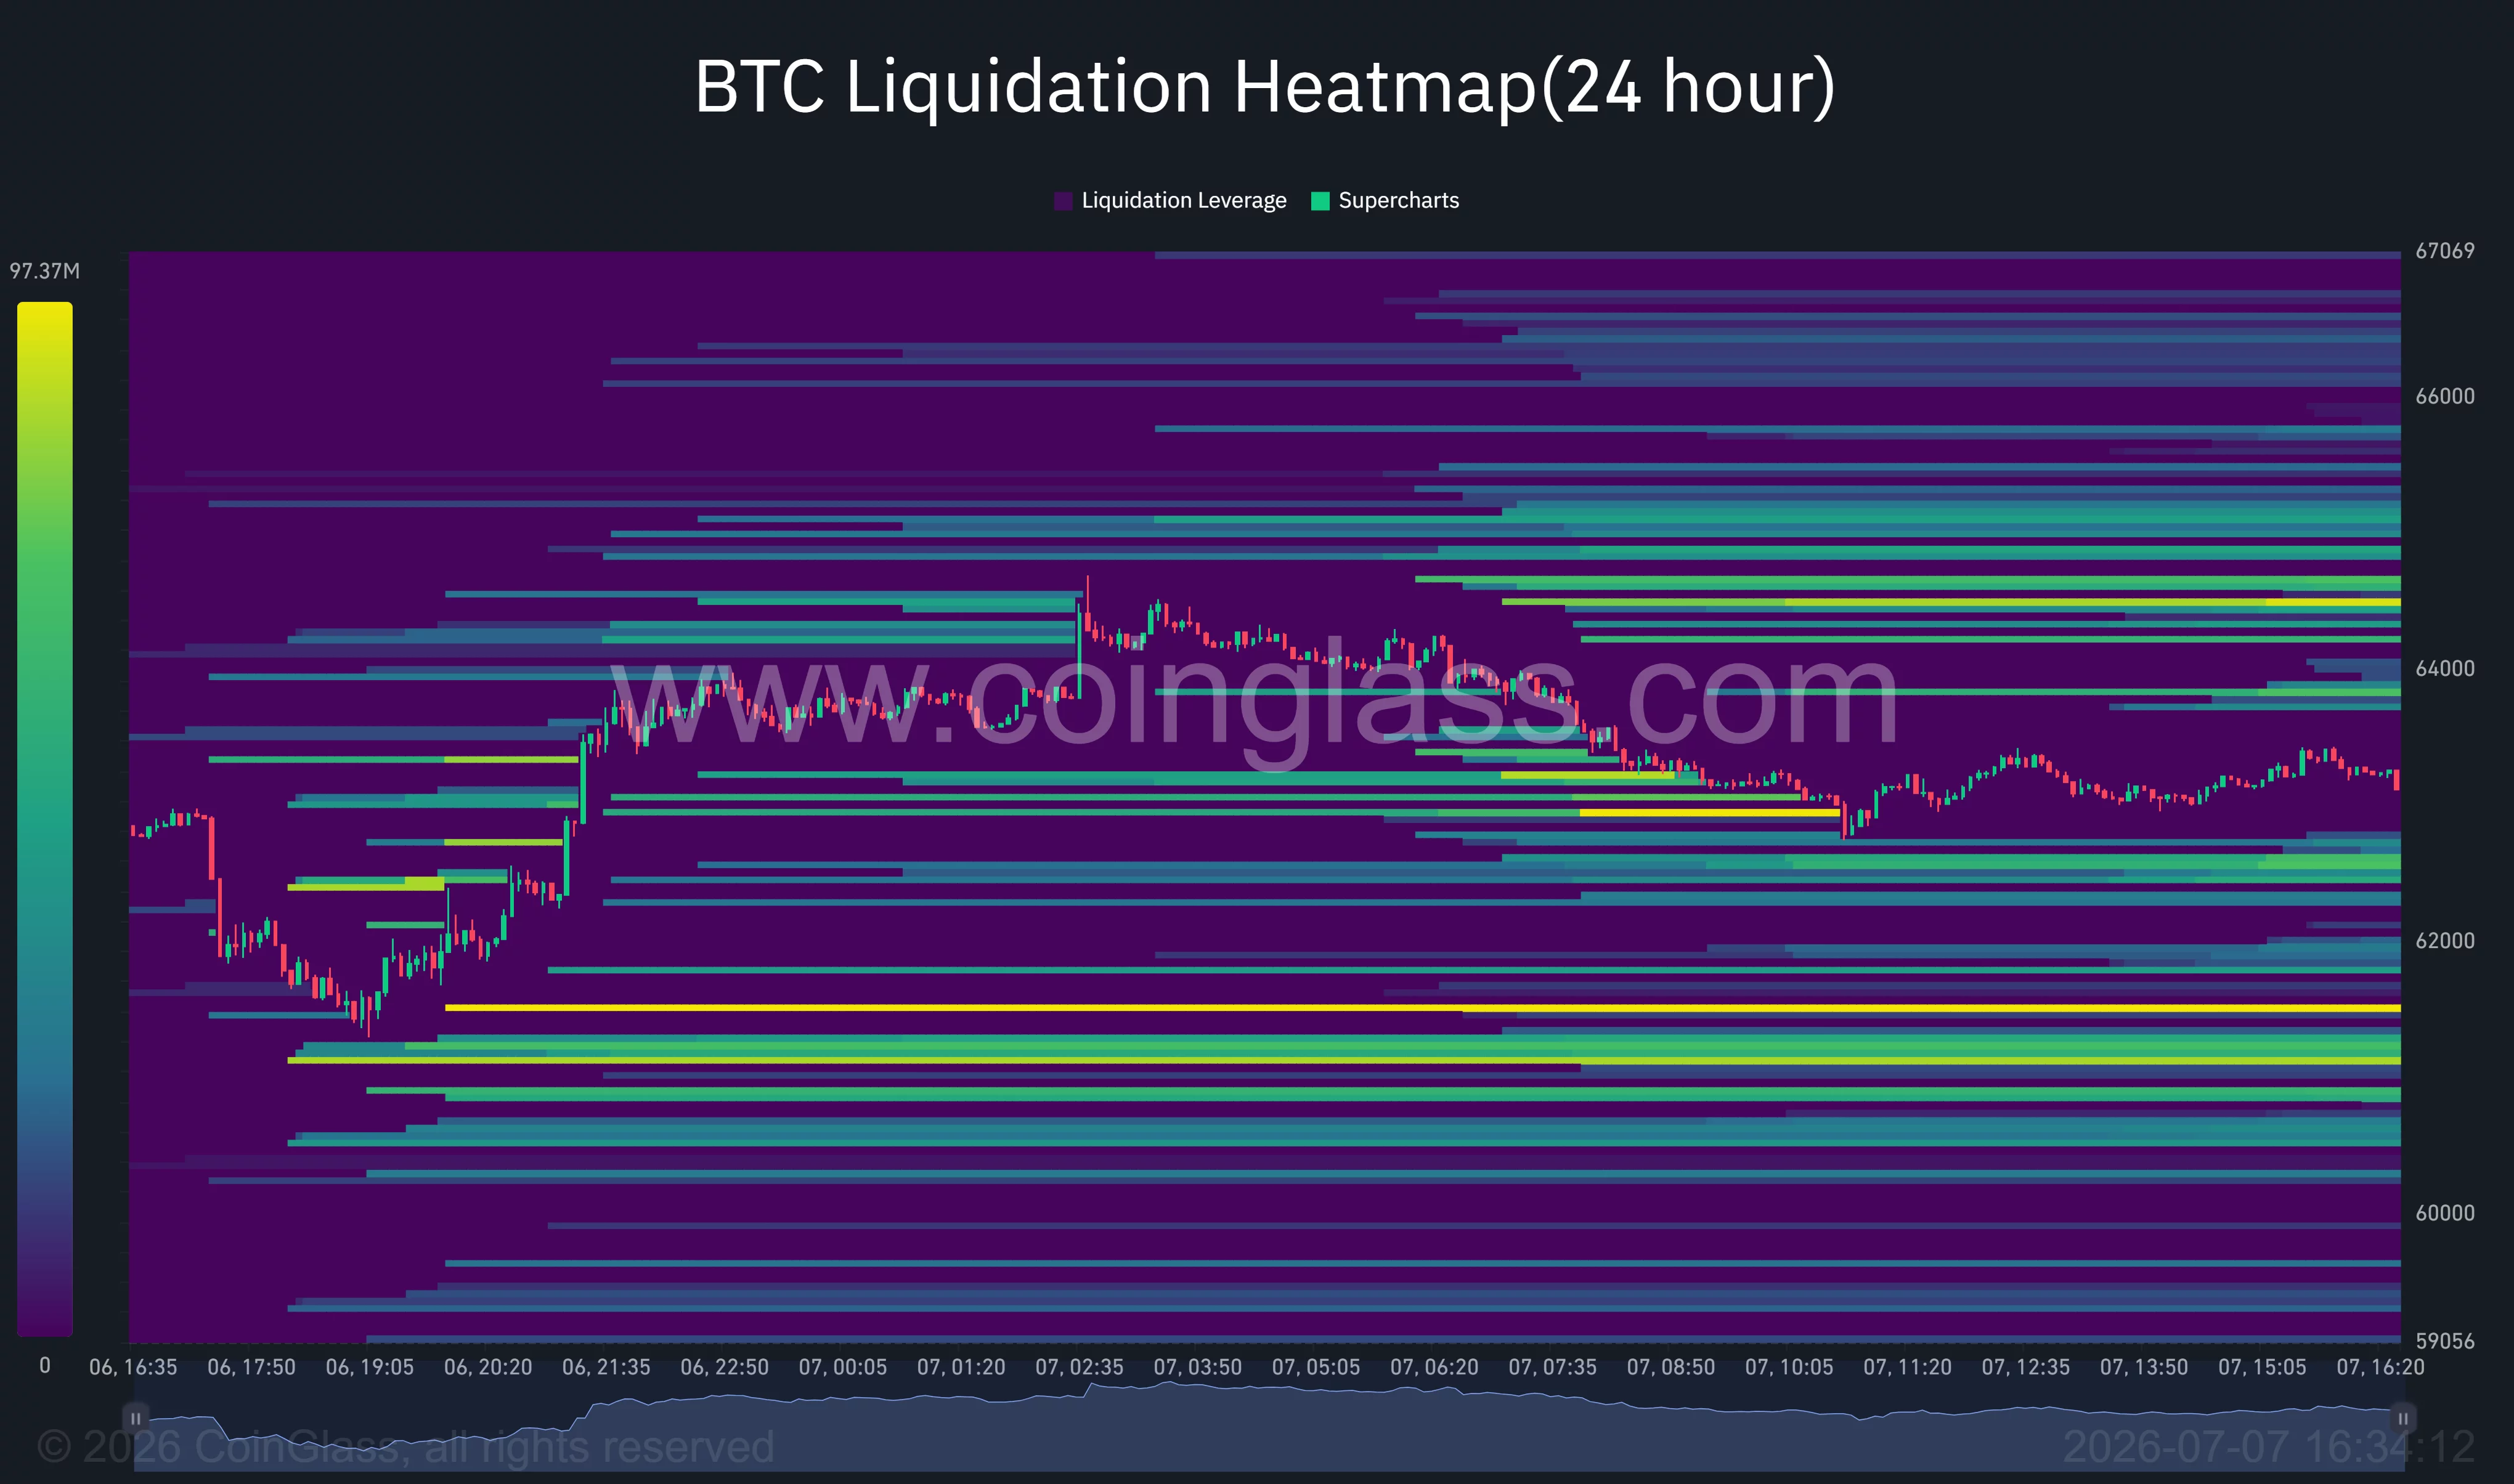
Derivatives positioning also shows traders clustering around nearby liquidation levels. CoinGlass’ 24-hour liquidation heatmap reveals dense short liquidation pools between $64,500 and $66,000, suggesting a decisive breakout could trigger another squeeze.
Bitcoin liquidation heatmap | Source:
CoinGlassOn the downside, a sizeable concentration of long liquidations sits around the $61,000-$61,500 region, increasing the probability of accelerated selling if support breaks.
Oil prices, Fed minutes and geopolitical risks could decide Bitcoin’s next move
Macro risks remain elevated despite growing expectations for Federal Reserve easing. Crude oil climbed above $69 per barrel after a Qatar state-owned LNG carrier was struck by a projectile near the Omani coast while exiting the Strait of Hormuz, reviving concerns over shipping security and the durability of the U.S.-Iran understanding in the region. A sustained rise in energy prices could complicate the Fed’s inflation outlook if geopolitical tensions intensify.
Additional volatility may arrive with the release of the Federal Open Market Committee meeting minutes, which traders expect to provide fresh guidance on the timing of future rate cuts. According to analyst Ted Pillows, Bitcoin has already formed “a bearish divergence on the 4H timeframe,” adding that “This looks bad in the short term.”
Failure to reclaim $64,000 could leave Bitcoin vulnerable to another test of the $60,700-$61,000 support area. A break below that region would expose the recent rebound to deeper profit-taking, while a decisive move above $65,000 could target the large liquidity cluster extending toward $66,000 and potentially revive the short-squeeze that fueled last week’s rally.
Disclosure: This article does not represent investment advice. The content and materials featured on this page are for educational purposes only.
Read more: Peter Schiff calls Strategy a Ponzi after $216M BTC sale