Bitcoin is drawing fresh interest from buyers after printing a new yearly low near $59,000 last week, with market microstructure data suggesting downside momentum may be fading rather than ac
Bitcoin is drawing fresh interest from buyers after printing a new yearly low near $59,000 last week, with market microstructure data suggesting downside momentum may be fading rather than accelerating. Since that low, BTC has rebounded to around $63,500, while several liquidity and positioning indicators point to a potential push higher if key resistance areas are reclaimed.
Order book and derivatives-related signals highlighted in recent analysis also point to a large concentration of short liquidity above current prices—an often-cited setup for a squeeze—while chart structure increasingly resembles patterns traders associate with breakouts toward the high-$60,000s.
Key takeaways
- BTC’s bid-ask ratio stayed positive after the $59,000 yearly low, suggesting buy-side orders are slightly outpacing sell-side pressure (Hyblock data).
- Analysts cite a short-liquidity cluster near $64,600 as a major upside magnet, with an estimated $2.68 billion in shorts.
- On the four-hour chart, divergence between price action and the RSI supported a rebound from the early-June sell-off lows.
- Traders are watching $64,000 and $66,000 as the most important levels to turn the current recovery into a sustained upside move (X analysis by Ardi and PLTR).
- Weekend flows may add volatility, with weekly profit-taking potentially producing opposing order-flow dynamics after long positioning builds (PLTR).
Order book signals hint at a squeeze setup
Following the yearly low near $59,000, Hyblock’s order book metrics showed BTC maintaining a positive bid-ask ratio of 0.05 after the drop, according to the data referenced in this report. In Hyblock’s framework, the bid-ask ratio is used to reflect whether aggressive buy-side market orders are stronger than aggressive sell-side orders. A positive reading indicates that—at least at the time of measurement—buyers were slightly more forceful than sellers.
Further support comes from cumulative volume delta (CVD) observations cited in the same analysis. CVD is used to estimate net buying or selling pressure over time by tracking volume imbalances. The article notes that smaller order cohorts (up to $10,000 and $100,000) showed improving buying activity, with $53 million and $157 million respectively. More notably for momentum traders, the largest cohort ($100,000 to $10 million) reportedly reduced net selling pressure by $900 million, suggesting that heavy participants were not adding to downside pressure.
At the same time, a crypto analyst identified a dense pool of short liquidity higher up. Kripto Holder pointed to a short-liquidity cluster near $64,600, describing it as the primary upside liquidity pool with $2.68 billion concentrated in that area. The practical implication for traders is that if price moves into that zone, it can increase the likelihood of shorts being forced to cover—potentially accelerating the move upward.
Chart structure: divergence and an ascending triangle
Beyond order book mechanics, the rebound also aligns with a technical signal seen on the four-hour timeframe. The referenced analysis describes a bullish divergence between BTC’s price and the relative strength index (RSI): during the early-June sell-off, price made a lower low, while the RSI formed a higher low. Divergences of this type are commonly interpreted as signs that downside momentum is weakening and selling pressure may be losing strength.
The same report also frames BTC’s current positioning within an ascending triangle pattern. If an upside breakout occurs, the analysis suggests BTC could target a daily fair value gap between $67,500 and $70,500—described as a liquidity gap left behind during the recent market correction. Traders often look to these “imbalance” zones as potential areas where price may mean-revert, especially when order book liquidity and derivatives positioning also favor upward movement.
Key levels to watch: $64,000 and $66,000
As BTC attempts to regain control, two horizontal/structural levels are being emphasized by market analysts. Crypto trader Ardi argued that BTC is still trading within a bear pennant after its decline from approximately $83,000 down toward $59,000. In that framing, $64,000 and $66,000 are presented as the most important prices for the current recovery.
According to Ardi, moving above $64,000 would help clear both a horizontal resistance area and the bear pennant structure. That would, in turn, open additional room for upside. The next hurdle is near $66,000, described as a former major range support level that has since turned into resistance.
If BTC can reclaim $66,000, the analysis claims it would strengthen the case for a move toward the liquidity zone above current price and toward the unfilled fair value gap area between $68,000 and $70,000. In other words, the argument is not just for a short-term bounce, but for a continuation if price can confirm its break through the key resistance levels.
Positioning is building—but weekend dynamics could complicate it
Attention is also on how derivatives positioning is evolving. Market analyst PILTR noted that BTC long exposure has been increasing over roughly the past five days, citing a long-versus-short imbalance of 237 long levels against 128 short levels. Based on that distribution, the report estimates a $4 billion positive imbalance.
Yet, the same analyst flagged weekend positioning as a near-term variable. The observation is that weekly profit-taking can sometimes create opposing flows into weekends, particularly after a sustained build-up of long exposure. For readers and traders, this matters because it highlights an uncertainty: even if the technical and liquidity setup is favorable, the timing of follow-through—especially around weekend trading—may determine whether buyers can sustain gains or whether momentum fades.
Ardi and PLTR’s outlooks share a theme: the path upward depends on BTC not only pushing higher, but also holding above specific thresholds long enough to invalidate the prior bearish structure. Until that happens, the market may remain sensitive to fluctuations in positioning and execution quality reflected in order book and CVD behavior.
Going forward, the most important things to monitor are whether BTC can hold above $64,000 and then reclaim $66,000 without losing momentum—since those levels are repeatedly cited as the triggers for a more durable upside move. Even with bullish microstructure signals, weekend positioning and profit-taking could still swing order-flow dynamics, so traders may want to watch how quickly liquidity reacts as price approaches the short-liquidity pool near $64,600.
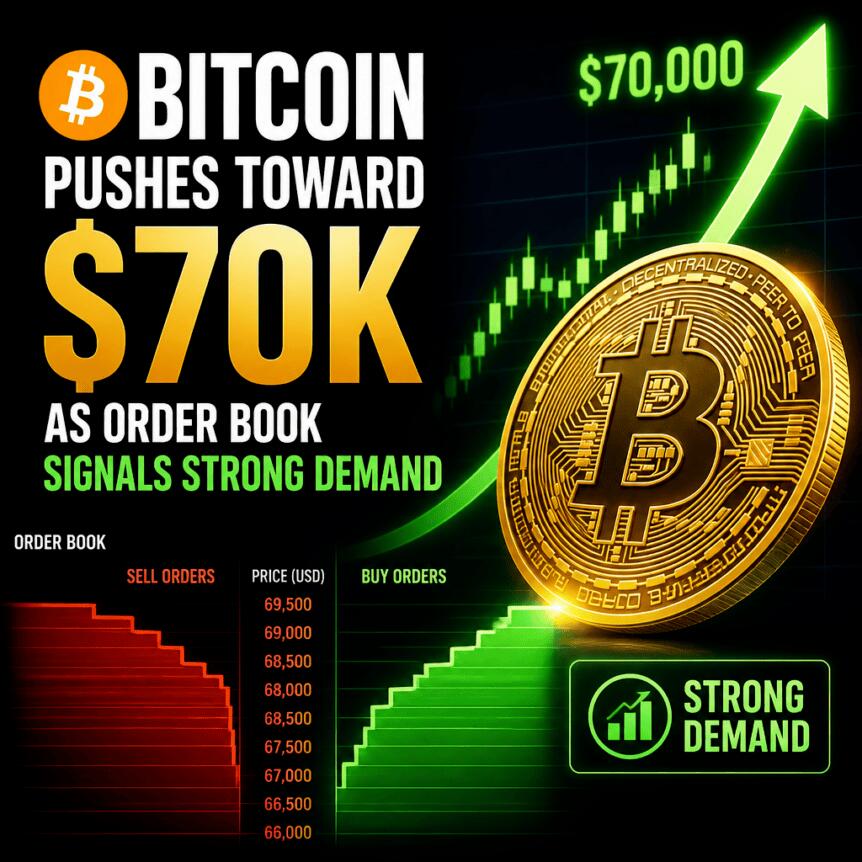
This article was originally published as Bitcoin Pushes Toward $70K as Order Book Signals Strong Demand on Crypto Breaking News – your trusted source for crypto news, Bitcoin news, and blockchain updates.