Bitcoin Price trades near $62.8K while CryptoQuant identifies $53.6K as a key valuation support area. ETF demand growth fell to negative territory as overall Bitcoin demand dropped by 652,000
- Bitcoin Price trades near $62.8K while CryptoQuant identifies $53.6K as a key valuation support area.
- ETF demand growth fell to negative territory as overall Bitcoin demand dropped by 652,000 BTC last week.
- Realized losses remain below historic capitulation levels, leaving cycle-bottom confirmation unresolved.
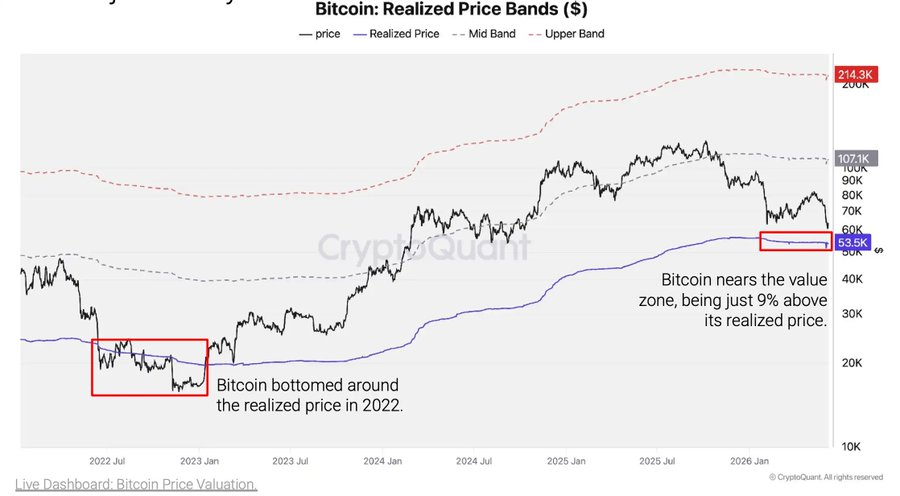
Bitcoin Price remained resilient after recovering toward $62,838. Market attention shifted toward CryptoQuant’s $53,600 realized-price level, which the firm identified as a potential valuation support area rather than a confirmed cycle bottom.
CryptoQuant Identifies Key Valuation Zone
Wu Blockchain shared CryptoQuant’s latest assessment on Bitcoin valuation. The report focused on Bitcoin’s realized price near $53,600.
Source:
XRealized price represents the average acquisition cost of circulating coins. Many analysts monitor this level during major market corrections.
The accompanying chart showed Bitcoin trading roughly 9% above realized price. That positioning places the asset near a historically important valuation area.
CryptoQuant described the level as a valuation bottom candidate. However, the firm avoided labeling it a confirmed market bottom.
Demand Metrics Continue Showing Weakness
The report noted a sharp decline in Bitcoin demand recently. Total demand reportedly fell by 652,000 BTC last week.
At the same time, ETF demand growth weakened considerably. The 30-day ETF demand figure dropped to negative 74,000 BTC.
Those figures indicate reduced buying activity across important market segments. As a result, price recovery attempts have faced persistent resistance.
CryptoQuant also pointed to holder-loss data for additional context. Recent realized losses remain below levels seen during historic capitulation periods.
Bitcoin Price Rebounds While Support Holds
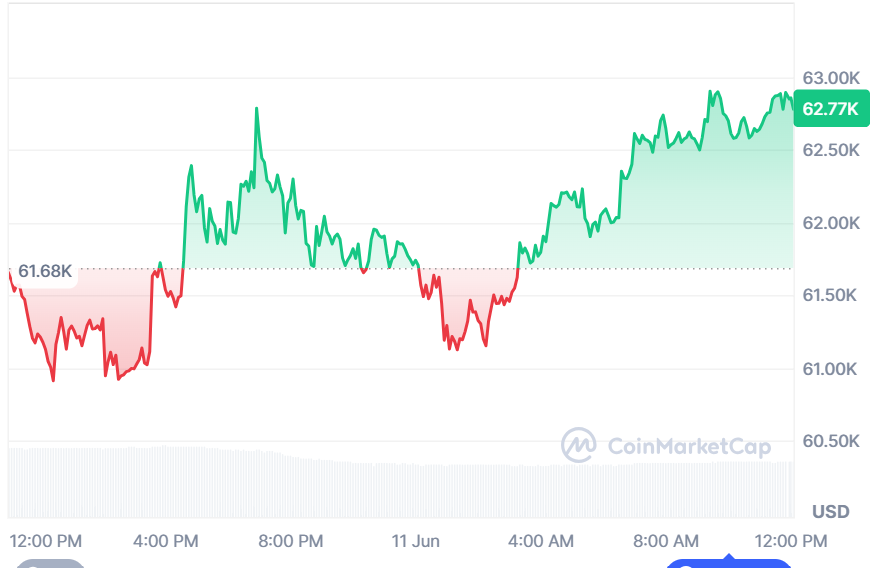
Despite weak demand metrics, Bitcoin Price showed short-term strength. CoinMarketCap data placed the asset at $62,838.
Source:
CoinmarketcapThe session began with selling pressure near the $61,700 area. Price later declined toward support around $61,000.

Buyers returned quickly after the market tested lower levels. Repeated rebounds suggested active demand near key support zones.
Bitcoin broke out of the $61,700 resistance level and gained momentum. The change sparked a rally up to the $62,400 area.
Price then entered a consolidation phase above prior resistance. That behavior often reflects stability following a sharp advance.
Higher lows emerged during the latter part of the session. The pattern pointed to improving short-term market structure.
Bitcoin later approached the psychological $63,000 threshold. Price remained close to session highs into the trading close.
Market capitalization rose alongside the recovery move. The 24-hour trading volume, meanwhile, fell about 21%.
The lower volume indicated what the market had in hand, not what it was projecting. Traders continue monitoring whether momentum can extend above $63,000.
CryptoQuant’s valuation model remains a central reference point. Yet confirmation of a cycle bottom still depends on stronger demand conditions and broader market participation.
The post Bitcoin Realized Price Signals Key Support Zone appears on Crypto Front News. Visit our website to read more interesting articles about cryptocurrency, blockchain technology, and digital assets.