Bitcoin rebounded 8.5% to above $80,000, with $80,500-$81,000 acting as the next key resistance zone. Ali Charts says the TD Sequential flashed a 4-hour sell signal after its previous buy sig
- Bitcoin rebounded 8.5% to above $80,000, with $80,500-$81,000 acting as the next key resistance zone.
- Ali Charts says the TD Sequential flashed a 4-hour sell signal after its previous buy signal preceded the recent rebound.
- RSI and MACD remain positive, but analysts warn that overbought conditions and downside leverage could amplify a pullback.
Bitcoin has climbed back above $80,000 after an 8.5% rebound, but analysts now see signs of cooling momentum. Ali Charts said the TD Sequential flashed a sell signal on Bitcoin’s 4-hour chart. Meanwhile, Ted Pillows is watching $83,000, while Coin Signals cited overbought readings and downside leverage.
https://twitter.com/TedPillows/status/2101238792455700548?s=20
Bitcoin Reaches Key Resistance Zone
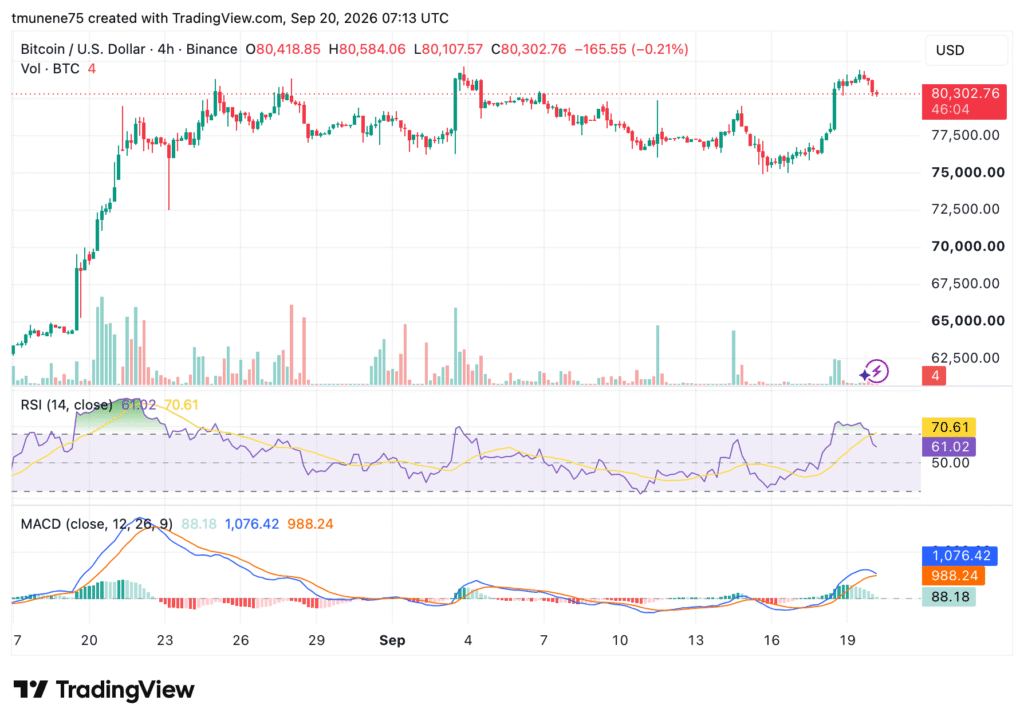
Bitcoin traded at $80,302 on the 4-hour chart, with the latest candle reaching $80,584. However, it later fell to $80,107, showing selling pressure near the session high. The recovery began around Sept. 16, when BTC traded near $75,000-$76,000.
Source:
TradingView
Price then formed higher lows and moved above $77,500 and $79,000. By Sept. 19, Bitcoin had reached about $80,800-$81,000. The latest trading has therefore centered near that local high.
The next resistance is around $80,500-$81,000. A sustained break could expose $82,000-$82,500, while support remains at $79,000.
Ali Charts Flags Fresh TD Sell Signal
Ali Charts said the TD Sequential had accurately tracked recent Bitcoin moves on the 4-hour chart. Its previous buy signal preceded the latest 8.5% rebound. However, the indicator has now flipped and produced a sell signal. Ali Charts said the reading suggests short-term momentum could be stretched.
He is watching for signs that traders may start taking profits after the recent advance. Meanwhile, Ted Pillows said Bitcoin appears set to close above its 50-week moving average. He said BTC needs to break above $83,000 to confirm the bottom.
Momentum Remains Positive on the Chart
The RSI is at 61.02, while its moving average is at 70.61. RSI remains above 50 but below the 70 overbought threshold. MACD also remains positive, with its line at 1,076.42 above the 988.24 signal line. The histogram is at 88.18.
Coin Signals said Bitcoin held firm despite four to five major bearish headlines. However, it warned that another larger bearish catalyst could challenge current strength. The analyst also pointed to overbought readings on some timeframes and significant downside leverage.
https://twitter.com/CoinSignals_/status/2101482906535497758?s=20
If that leverage unwinds, Coin Signals said the move could be sharp. The chart shows $77,500 as the next support after $79,000, followed by $75,000-$76,000.