Key Highlights Bitcoin trades at $65,162 (−1.99% 24h) — 13.4% above the analyst's July 1st candidate bottom of $57,750 An analyst sets December 1st as the hard deadline to flip 100% bullish,
Key Highlights
Bitcoin trades at $65,162 (−1.99% 24h) — 13.4% above the analyst's July 1st candidate bottom of $57,750
An analyst sets December 1st as the hard deadline to flip 100% bullish, warning BTC risks becoming its longest bear market in history
Spot Bitcoin ETFs posted 5 consecutive outflow days totaling −$1.07B with IBIT alone shedding −$143.5M, per SoSoValue
$57,750 (July 1st low) is the structural reference level — a confirmed bullish structure above it before Dec 1 validates the cycle bottom
Bitcoin is trading at $65,162 — down 1.99% in the past 24 hours — with a market cap of $1.31 trillion, and the question one analyst is now forcing onto the table is whether this cycle has quietly shifted from the shortest bear market in Bitcoin’s history to potentially its longest.
That framing comes from a crypto analyst who goes by the handle @CryptoBullet1, who posted on November 15, 2026: “From the shortest bear market to potentially the longest bear market in $BTC history. So now you see why I set December 1st as the deadline to flip 100% bullish.” The post drew 13,800 views and references a prior call from September 8, 2026, in which the same analyst had flagged July 1st ($57,750) as a potential bear market bottom — drawing parallels to the October 4, 2018 bottom, the October 17, 2022 bottom, and the November 21, 2014/15 bottom.
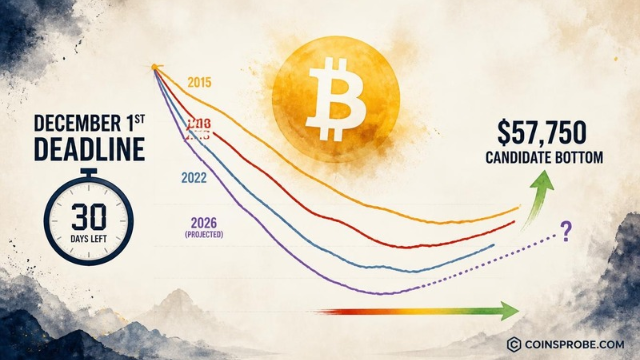
The chart shared by the analyst overlays four historical Bitcoin bear market cycles — 2015, 2018, 2022, and a projected 2026 path — as cascading declining price curves, each bottoming at different depths and durations. The chart annotates the current price at 65,474.64 on the daily timeframe, with labeled historical bottoms and a “Bottom 2026??” marker positioned later in the timeline. The price axis spans from roughly $11,800 at the lower bound to $125,000 at the upper range, and the date axis extends from early October 2025 through November 21, 2026 — the annotated endpoint of the chart’s projection window.

BTC Chart Analysis | Source: @CryptoBullet1 (X)
What the visual makes explicit is that the previous three bear markets each resolved within a narrower time window. The 2015, 2018, and 2022 cycles all bottomed in a range from roughly October to late November. The analyst’s thesis — reinforced by the September 8 post — is that those historical bottom dates (Oct 4, Oct 17, Nov 21) created an expectation that July 1 at $57,750 would serve as the 2026 cycle low. Bitcoin is currently trading 13.4% above that $57,750 level. But the analyst’s concern is that the market has not confirmed a clean reversal, and December 1st is now the hard line: flip 100% bullish by that date, or the bears retain structural control.
The December 1st deadline is not a price target. It is a time-based condition. The analyst’s prior post from September 8 set the framework: if Bitcoin does not establish a confirmed bullish structure by December 1st, the cycle risks extending beyond every comparable historical bear market in duration. That would make 2026 anomalous — a bear market longer than 2018’s or 2022’s, which both resolved by their respective Novembers.
The significance of the historical bottom dates cited — October 4 (2018), October 17 (2022), and November 21 (2014/2015) — is that they cluster tightly in a 47-day window each cycle. Bitcoin’s current price at $65,162 has not broken decisively above levels that would confirm the July 1st $57,750 low as the definitive cycle bottom. For context on where Bitcoin’s on-chain floor models sit relative to current price, Bitcoin’s CVDD floor model currently sits at $50.7K — well below current levels, which does provide a structural cost-basis floor.
The macro context around the December 1st deadline is not supportive at this moment. Data via SoSoValue shows Bitcoin spot ETFs posted a daily net outflow of -$185.5M on November 13, 2026, the fifth consecutive outflow day. The five-day running total stands at -$1.07 billion, with zero inflow days in that stretch. IBIT alone saw -$143.5M in outflows, while FBTC shed -$41.9M. Total ETF net assets remain at $86.20B with cumulative net inflows of $54.63B since launch — institutional capital is still net positive from inception, but the current directional flow is consistent with distribution, not accumulation.
Strategy (formerly MicroStrategy) continues to be the counterpoint: the firm added 1,036 BTC for $81.9M in its latest purchase and has accumulated 2,114 BTC for $169.5M over the past three weeks, bringing total holdings to 850,364 BTC as of November 9, 2026. That is a singular institutional buyer moving against the ETF trend — but one buyer does not define a cycle bottom.
Markets are currently pricing a high probability (roughly 80–90%) of a 25bp rate hike at the December 9, 2026 FOMC meeting, which would move the federal funds rate from the current 3.75%–4.00% range to 4.00%–4.25%. The January 27, 2027 meeting presents more divided pricing. This week also brings PPI (November 13), Retail Sales (November 17), and Core PCE alongside GDP (QoQ) on November 25. If Core PCE comes in hot, expectations for further tightening will likely strengthen — a potential headwind in the window the analyst is watching. Understanding where you stand in the broader market cycle psychology matters here: the data points are pointing toward late-cycle uncertainty, not early-cycle euphoria.
At $65,162, Bitcoin sits above its July 1st reference low of $57,750 by 13.4%, but the broader concern raised by the analyst’s cycle overlay is duration, not depth. The 2022 bear market saw Bitcoin touch its 200-week moving average as a final capitulation floor — a dynamic previously examined in detail here. Whether the $57,750 July low held the equivalent structural role in this cycle is precisely what December 1st will answer.
The analyst’s framework is binary by design. If Bitcoin demonstrates a confirmed bullish structure before December 1st, the cycle bottom call at $57,750 / July 1st gets validated and the analyst flips 100% bullish. If it does not, the 2026 bear market would have outlasted every comparable historical cycle in duration — a structurally different and historically unprecedented outcome for Bitcoin. The chart’s “Bottom 2026??” annotation is not a forecast; it is a question mark. The analyst is not calling for a crash to new lows — the question is whether the bottom already occurred in July or whether the cycle is still unresolved.
At $65,162 and 15 days from that deadline, Bitcoin is trading 13.4% above the $57,750 candidate low. The five-day ETF outflow streak of -$1.07 billion and the upcoming PCE data on November 24th are the near-term variables. The December 1st deadline is now the single most consequential date on this analyst’s calendar — and the market’s answer will either confirm the shortest-to-longest bear market thesis or retire it.
Watch $57,750 as the structural invalidation level and December 1st as the time-based confirmation gate.
Disclaimer: The views and analysis presented in this article are for informational purposes only and reflect the author’s perspective, not financial advice. Technical patterns and indicators discussed are subject to market volatility and may or may not yield the anticipated results. Investors are advised to exercise caution, conduct independent research, and make decisions aligned with their individual risk tolerance.
Also Read: DXY Hits 1-Year High at 103.41 — What It Means for Bitcoin