Markets only needed a few hours to waver. A surge in oil prices, triggered by escalating tensions in the Middle East, revived risk aversion and led to a sell-off in the most exposed assets. B
Markets only needed a few hours to waver. A surge in oil prices, triggered by escalating tensions in the Middle East, revived risk aversion and led to a sell-off in the most exposed assets. Bitcoin, which was still trying to consolidate its recent gains, found itself caught in a well-known mechanism: rising US bond yields, retreating expectations of Fed rate cuts, and the sudden return of geopolitical uncertainty. Can cryptos still escape macroeconomic turmoil?
In Brief
- Bitcoin faces rising geopolitical risks and falls to a three-day low of $64,799.
- After attacks in the Red Sea, Donald Trump mentions a massive response against Iran, pushing Brent oil above $100.
- Rising energy prices rekindle inflation fears, cause Wall Street to fall, and push US 10-year bond yields to 4.7%.
- Bitcoin Spot ETFs record $225.2 million in net outflows, breaking a 7-day positive flow streak.
The Military Escalation in the Middle East and the Surge in Energy Prices
The bitcoin price fell below the $65,000 threshold, reaching a three-day low at $64,799, under direct pressure from a severe resurgence of military tensions between Washington and Tehran. This correction was triggered after an attack by Iran-backed Houthi rebels on two Saudi tankers, the Encelia and Layla, targeted by ballistic missiles, cruise missiles, and drones in the Red Sea. A fire broke out on the bow of the Encelia vessel, although the crew emerged unharmed from the strike.
In response to this critical situation, the US government took several major steps :
- The threat of an unprecedented massive military response : during an interview with Axios, US President Donald Trump stated : “I’m aiming for a massive strike. Bigger than ever. I’m about to make a decision. We are all ready” ;
- Pressure on Iranian diplomacy : referring to talks through intermediary channels, Donald Trump said about Iranian leaders : “they have not yet felt enough pain” ;
- Involvement of regional allies : the US president specified regarding Israeli forces that the country “would join in two minutes if I asked” ;
- Financial sanctions and official warnings : on the social network Truth Social, Donald Trump promised “major military punishments“, suggesting damages caused to merchant ships could be covered by frozen Iranian assets under US control, while the US military completed its thirteenth consecutive night of targeted strikes.
The Stock Indices Drop and the Surge in Bond Yields
The impact of these declarations and naval clashes on global financial markets was immediate. Oil prices broke the $100 per barrel barrier for the first time since the end of May, with the Brent futures contract gaining 7% to reach $100.69 on July 23, while West Texas Intermediate (WTI) rose 6.3% to close at $92.28. According to UBS analyst Giovanni Staunovo, oil shipments in the Gulf region fell to 2.5 million barrels per day over the past seven days, compared to a 30-day average of 6 million barrels, while Iranian shipments dropped to zero from 1.5 to 2 million barrels per day at the start of July.
On Wall Street, stocks sharply fell under geopolitical risk, with the S&P 500 dropping 1.2% and the Nasdaq Composite down 2.2%. Meanwhile, the US 10-year Treasury yield climbed to around 4.7%, marking its highest level in 18 months and reflecting investors’ deep concern over renewed inflation pressures. As The Kobeissi Letter highlighted in a post on social network X: “inflation expectations and interest rates are strongly rising again.“.
Bitcoin Market Vulnerability and the Fading Buying Momentum
Beyond this external macroeconomic instability, the price deterioration occurs at a time when the internal structure of the bitcoin market shows clear signs of technical and institutional fragility. US-listed Bitcoin spot ETFs recorded net outflows of $225.2 million on July 23 alone, breaking a continuous seven-session positive streak that had accumulated nearly one billion dollars of capital inflows.
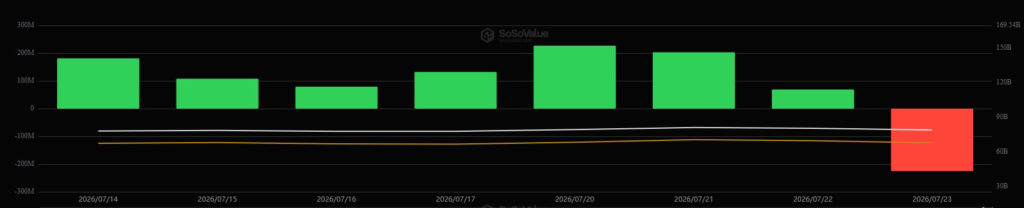
US Bitcoin ETF Flow in The Last 7 Days (Source : SoSoValue)
Based on on-chain data, Ki Young Ju, founder and CEO of CryptoQuant, observed that demand on the spot market has been almost zero or negative since June. The recent asset rebound was therefore almost exclusively sustained by the derivatives and futures market but with volumes and intensity significantly lower than those recorded in the previous rise three months earlier. This growing dependence on leverage makes long positions extremely vulnerable to a wave of forced liquidations if overall financial conditions tighten.
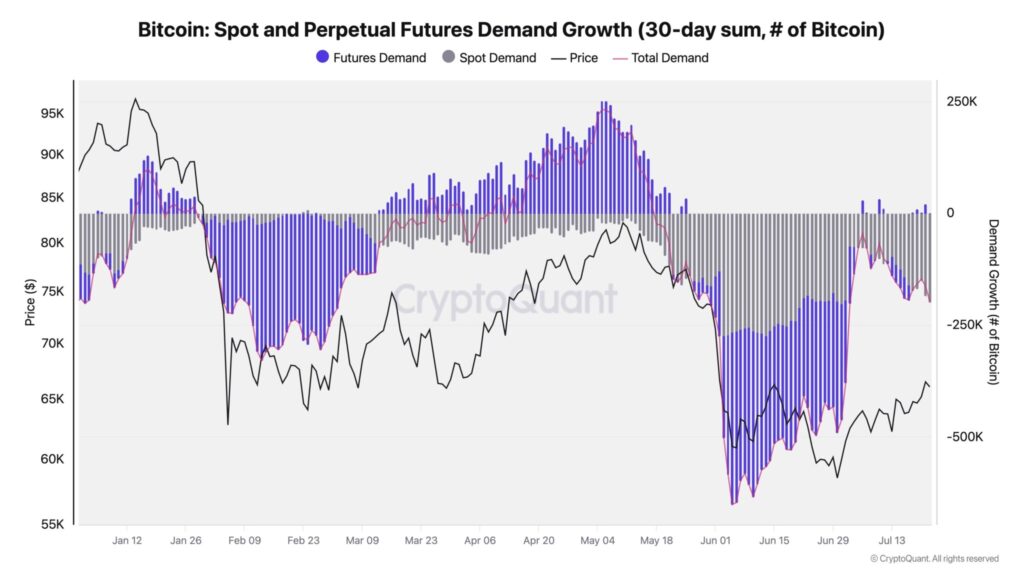
Bitcoin Spot and Perpetual Market Demand (Source : CryptoQuant)
This asymmetry between the derivatives and physical market feeds growing skepticism among investors, who fear a sudden price reversal. Analyst Exitpump thus advocates the utmost caution and recommends taking short positions given buyers’ inability to break key resistance levels. On network X, he openly warned his followers: “July rally is ending, price is at resistance, close your long positions, and switch to selling once price breaks below $65,000 threshold”.
Conversely, other market observers like trader Jelle offer a more tempered reading of the current chart situation. He believes the bullish structure built since the beginning of the month is not yet definitively compromised, emphasizing that the pullback currently has the appearance of an orderly technical correction as long as bitcoin manages to hold above major support lines, notably around the 21-day moving average. He states “If price manages to break this zone, there will hardly be any resistance until $70,000. The move could be very fast before forming a new price range. Patience remains my strategy”.
According to crypto trader and analyst Michaël van de Poppe, the simple 21-week moving average at $64,073 is a decisive level. “In theory, bitcoin has reached its target zone. As long as it stays above the 21-day moving average, I am convinced its valuation will continue to rise in the short term”, he wrote on X.
He adds: “It has just one last obstacle before a real breakout: the resistance zone at $68,000. It has already been tested once, and the market is now preparing to test it a second time”.
Your 1st cryptos with BinanceThis link uses an affiliate program.The Return of the Specter of Monetary Tightening and Sovereign Debt Tensions
The sudden surge in energy commodity prices is profoundly disrupting the calendar and monetary policy scenarios anticipated by major financial institutions. The CME FedWatch tool now shows nearly a 40% probability for a 25 basis points interest rate hike at the upcoming Federal Reserve policy committee meeting scheduled for July 28-29, whereas this likelihood was only 12% a week earlier.
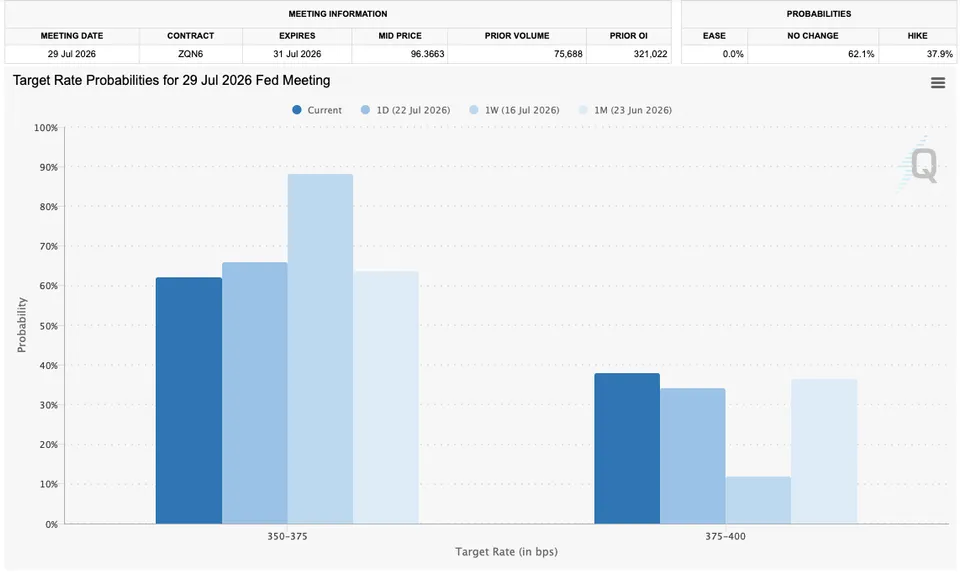
Fed target-rate Probability Comparison For July FOMC Meeting (Source : CME Group)
André Dragosch, head of research for Europe at Bitwise, warns of the cascading effects of prolonged expensive oil, estimating such a shock could push the US 10-year sovereign yield above 5%. According to him, this situation would force major crude importers, notably Japan, to massively liquidate their US Treasury portfolios to generate the liquidity needed to pay their energy bills in dollars.
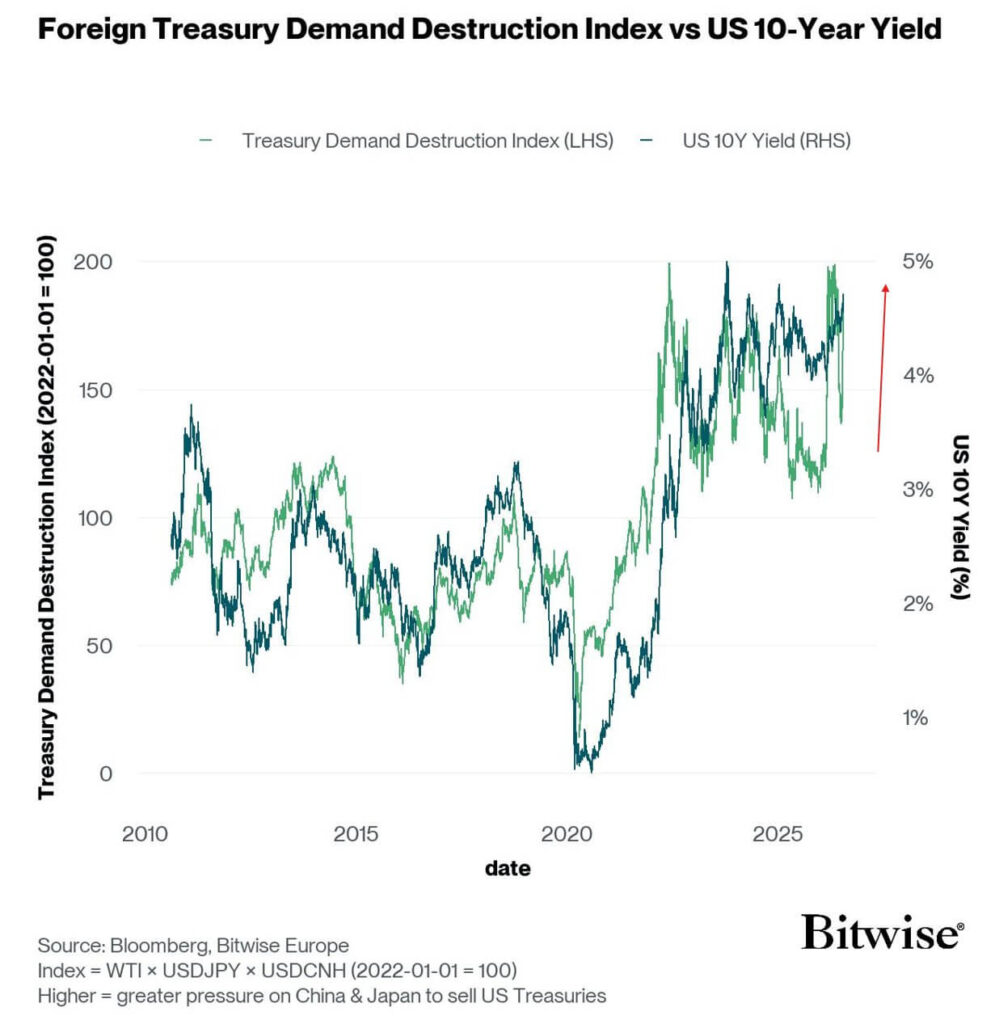
US 10-Year Yield (Source : Bitwise)
Jurrien Timmer, global macro research director at Fidelity Investments, highlights the complexity of the current environment for portfolio managers. The still positive correlation between stocks and bonds and rising term premiums deprive investors of traditional diversification mechanisms to absorb a global flight from risk.
In the long term, bitcoin’s trajectory remains closely dependent on the duration and severity of maritime disruptions in the strategic straits of Hormuz and Bab el-Mandeb, key passages to the Suez Canal. JPMorgan research teams estimate that each additional month of oil supply constraints would add between $7 and $8 per barrel to Brent’s price, pushing the monthly average toward $114 if the conflict extends at least three months. Goldman Sachs analysts take an equally cautious stance, warning that Brent may exceed $120 in the fourth quarter if maritime flows do not return to normal.
In this context of major uncertainty, Binance Research recalls that Bitcoin ended the first half of 2026 around $59,500, about 53% below its peak above $120,000 set in October 2025. While Binance Research suggests these valuation levels historically place bitcoin in a potential bottom zone approaching Q4, the firm notes that this technical signal remains to be confirmed. Bitcoin’s ability to hold its supports will therefore depend on the outcome of Federal Reserve decisions on July 28-29 and the stabilization of the geopolitical front in the Middle East.