BTC trades near $63,000 at the time of writing, after the support highlighted in our previous analysis failed to survive the July 31 close. Buyers initially reacted around the overlap between
BTC trades near $63,000 at the time of writing, after the support highlighted in our previous analysis failed to survive the July 31 close.
Buyers initially reacted around the overlap between the 50-day simple moving average and the 0.236 Fibonacci retracement, but Bitcoin finished the session below both.
The July 31 Defence Failed at the Close
The 50-day SMA sits near $63,370, while the Fibonacci retracement is slightly higher at approximately $63,620.
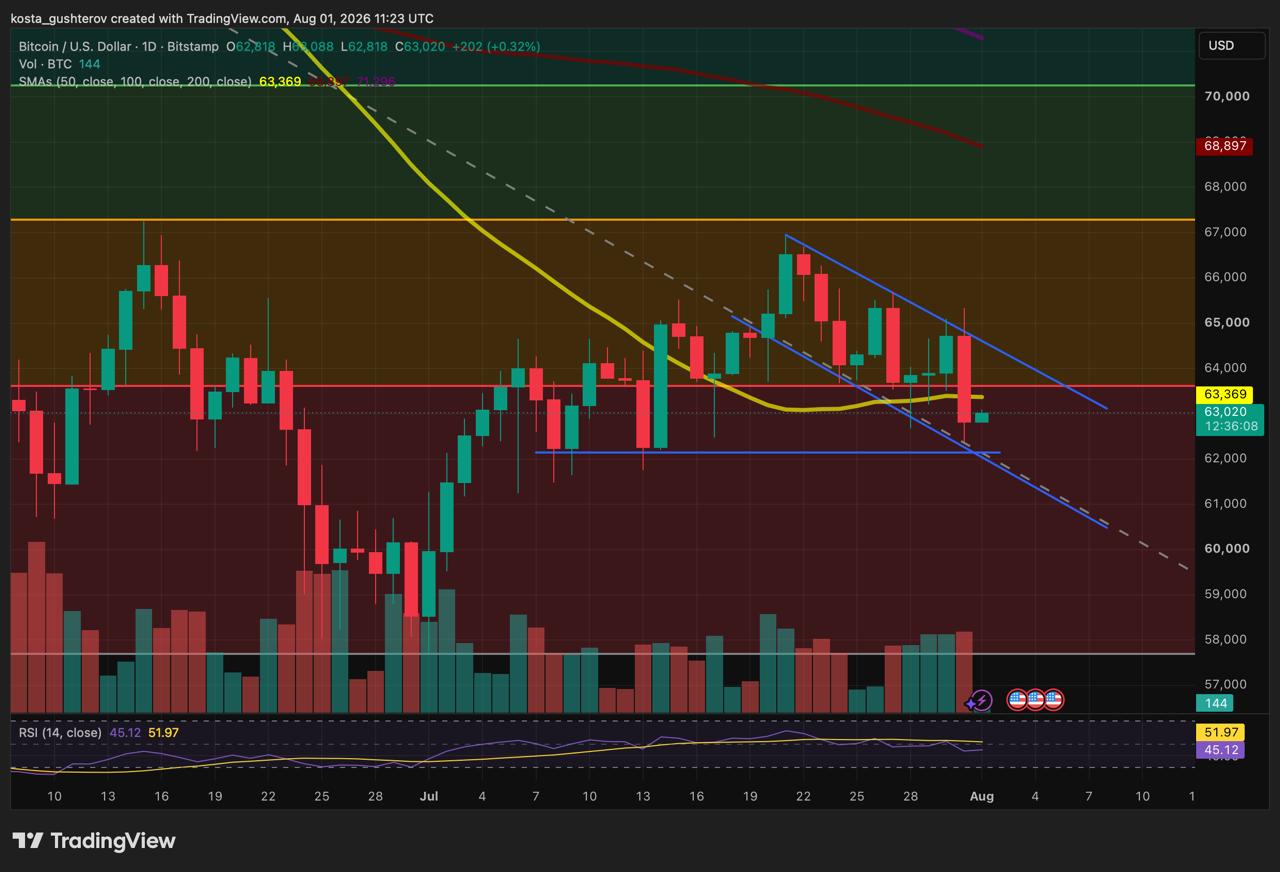
Bitcoin/USD technical price chart
showing the drop under the support as of August 1, 2026.
Their proximity makes them one resistance area rather than two separate barriers. A brief move back into the range would not repair the breakdown; Bitcoin would need to close above both levels.
Price also remains inside the descending channel drawn from the July 21 high. Its sequence of lower highs remains intact.
The lower boundary of the channel is approaching horizontal support around $62,100. That area stopped the pullbacks on July 9 and July 14, showing that buyers have previously responded there.
A daily close below it would break both the horizontal floor and the lower channel boundary. The current chart does not show another clearly established support immediately underneath.
READ MORE:
 Bitcoin Fell Before Every Past US Midterm – Will 2026 Repeat It?
Santiment recorded 0.58 bullish Bitcoin comments for every bearish comment across the social platforms it tracks. The firm described it as the lowest positive-to-negative ratio since its modern monitoring began.
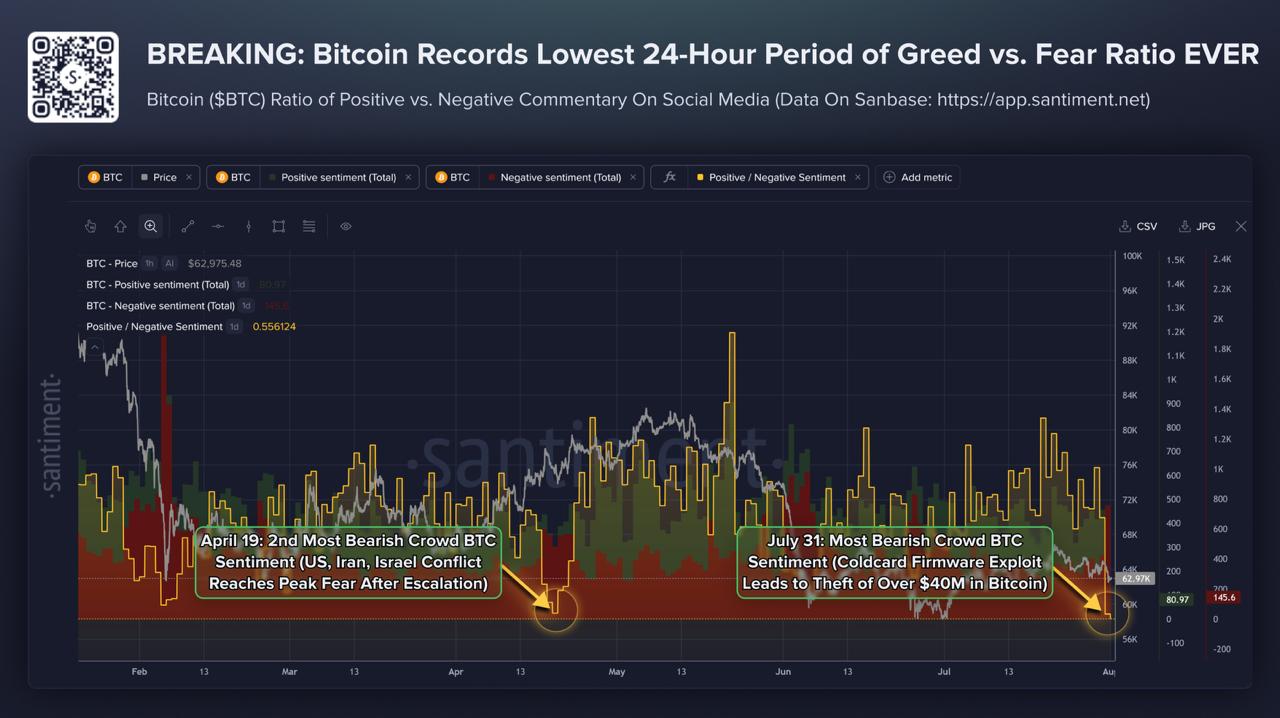
Santiment data revealing record bearish Bitcoin crowd sentiment following the July 31 Coldcard firmware exploit.
The reading followed reports of a Coldcard firmware exploit, bringing concerns about self-custody security back into focus. Hardware wallets are often treated as the safest option for long-term storage, yet the incident showed that even established devices can still contain software flaws.
Even Binance founder Changpeng Zhao weighed in on the issue, warning that no storage method is completely free of risk:
“Even hardware wallets can have bugs. Even old wallets with a long history can have bugs.
How to mitigate? Split your funds in a few wallets maybe? This has a different set of risks. Nothing is 100%.
Stay informed. Stay SAFU!”
— Changpeng Zhao (@cz_binance) on X
Zhao’s comments captured the broader concern raised by the Coldcard report. Self-custody removes reliance on an exchange, but it does not eliminate technical risk. Dividing funds across several wallets may reduce exposure to a single vulnerability, although it also creates more devices, backups and recovery phrases that users must secure.
The ratio provides context for the weak market mood, but it is not a directional signal. It covers one day, and extreme negativity can appear during both continued declines and the later stages of selling.
The next clearer signal would come from a daily close back above the former support band or below $62,100.
- Disclaimer: This article is for informational purposes only and does not constitute financial or investment advice. Technical levels and social sentiment indicators do not guarantee future price performance.
- Methodology: The analysis uses the BTC/USD daily Bitstamp chart dated August 1, 2026, including the 0.236 Fibonacci retracement, 50-day SMA, horizontal support and descending channel. Sentiment data comes from Santiment’s August 1 analysis of positive and negative Bitcoin commentary across tracked social platforms.
The post Bitcoin Slips to $63,000 – Market Sentiment Cracks appeared first on Coindoo.
