BitcoinWorld Bitcoin Spot CVD at 6:00 a.m. UTC: Order Flow Signals Mixed as Volume Heatmap Highlights Key Levels At 6:00 a.m. UTC on July 31, the Bitcoin spot market on Binance’s BTC/USDT pai
BitcoinWorld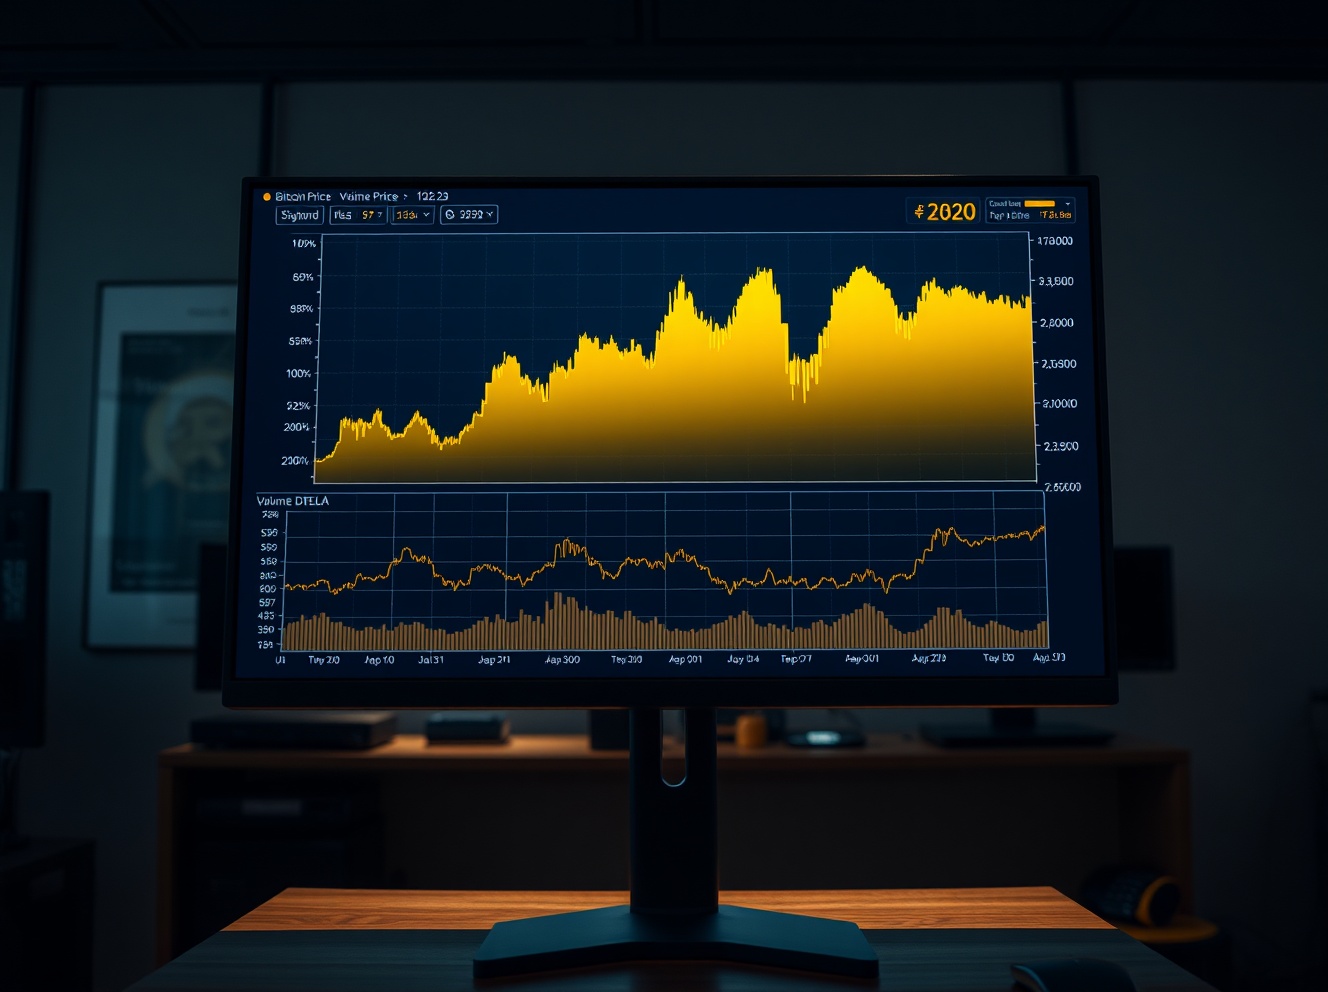 Bitcoin Spot CVD at 6:00 a.m. UTC: Order Flow Signals Mixed as Volume Heatmap Highlights Key Levels
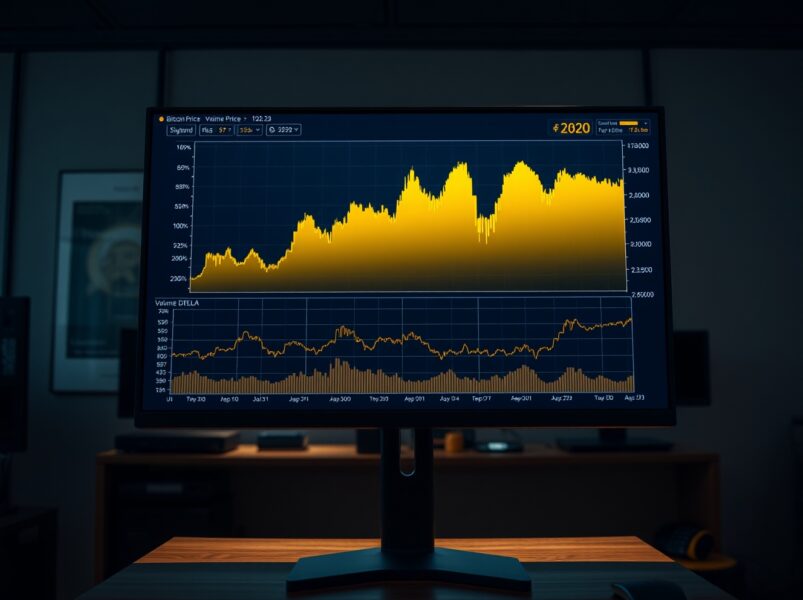
At 6:00 a.m. UTC on July 31, the Bitcoin spot market on Binance’s BTC/USDT pair presented a nuanced picture for traders tracking order flow. The Spot Cumulative Volume Delta (CVD) chart, a key tool for analyzing buying and selling pressure, showed mixed signals across different order sizes, while the accompanying Volume Heatmap highlighted several price levels that could act as support or resistance in the coming sessions.
Understanding the Spot CVD Chart
The Spot CVD chart is an order-book analysis tool that tracks the net difference between aggressive buy and sell orders executed at the market price. The upper panel displays a Volume Heatmap, which visualizes trading activity at various price levels. Brighter zones on the heatmap indicate areas where the price has lingered or moved sharply, suggesting these levels may be watched by traders for potential support or resistance.
The lower panel shows the Cumulative Volume Delta (CVD), which accumulates the difference between buy and sell volume over time. The indicator is broken down by order size, with the yellow line representing orders between $100 and $1,000, and the brown line representing large orders between $1 million and $10 million. This segmentation helps traders gauge whether retail or institutional-sized participants are driving the market.
Key Observations from the July 31 Data
According to the chart data at 6:00 a.m. UTC, the CVD lines showed a divergence: the yellow line (small orders) appeared to be trending upward, indicating net buying pressure from smaller retail traders, while the brown line (large orders) showed a flatter or slightly declining trajectory, suggesting that larger players were less aggressive in their buying. This divergence can sometimes precede a shift in market direction, as smaller orders are often less influential than large block trades.
The Volume Heatmap revealed a bright cluster near the $66,000 to $67,000 range, suggesting significant trading activity at those levels. This zone could act as a support area if the price retraces, while a lack of bright zones above the current price might indicate weaker resistance overhead, potentially allowing for upward movement if buying pressure intensifies.
Why This Matters for Traders
For day traders and swing traders, the Spot CVD chart provides real-time insight into order flow dynamics that are not visible on standard price charts. By monitoring CVD trends and heatmap levels, traders can better time entries and exits, and anticipate potential breakout or reversal points. The mixed signals on July 31 suggest that the market is in a state of equilibrium, with no clear dominant side, which often leads to range-bound trading until a catalyst emerges.
Broader Market Context
Bitcoin’s price action on July 31 occurs against a backdrop of ongoing regulatory discussions and macroeconomic data releases. Traders are also monitoring the potential impact of the upcoming Federal Reserve meeting and inflation reports, which could influence risk appetite across crypto markets. The order flow data, while useful for short-term analysis, should be considered alongside broader market sentiment and news events.
Conclusion
The Spot CVD chart for BTC/USDT at 6:00 a.m. UTC on July 31 reveals a balanced order flow, with small retail orders showing slight buying pressure while large orders remain cautious. The Volume Heatmap identifies key levels around $66,000-$67,000 as potential support. Traders should watch for a decisive move in CVD, particularly in the large-order segment, to gauge the next directional bias.
FAQs
Q1: What is Spot CVD and how is it used?Spot CVD, or Cumulative Volume Delta, is an order flow indicator that measures the net difference between aggressive buy and sell orders in a spot trading pair. It helps traders understand whether buyers or sellers are more active, and when broken down by order size, it can reveal the behavior of different types of market participants.
Q2: What does the Volume Heatmap show?The Volume Heatmap displays trading volume at various price levels over a period. Brighter areas indicate higher trading activity, which can act as support or resistance zones. Traders use these levels to anticipate price reactions.
Q3: How should traders interpret the divergence between small and large order CVD lines?A divergence, where small orders show buying while large orders show selling or flat activity, can indicate a lack of conviction among institutional players. This may lead to a range-bound market or a potential reversal if large players change their stance.
This post Bitcoin Spot CVD at 6:00 a.m. UTC: Order Flow Signals Mixed as Volume Heatmap Highlights Key Levels first appeared on BitcoinWorld.