Markets8 min read
Inflation Never Really Left. Markets Just Stopped Looking.
For months, investors convinced themselves that inflation was defeated. Oil, geopolitics, and central banks are now reminding markets that the story may be far from over.
Bitcoin retreated to around $66,000 after Tuesday’s Wall Street open as broader equity markets pushed higher. The move underlined a growing split between crypto and traditional risk assets, e
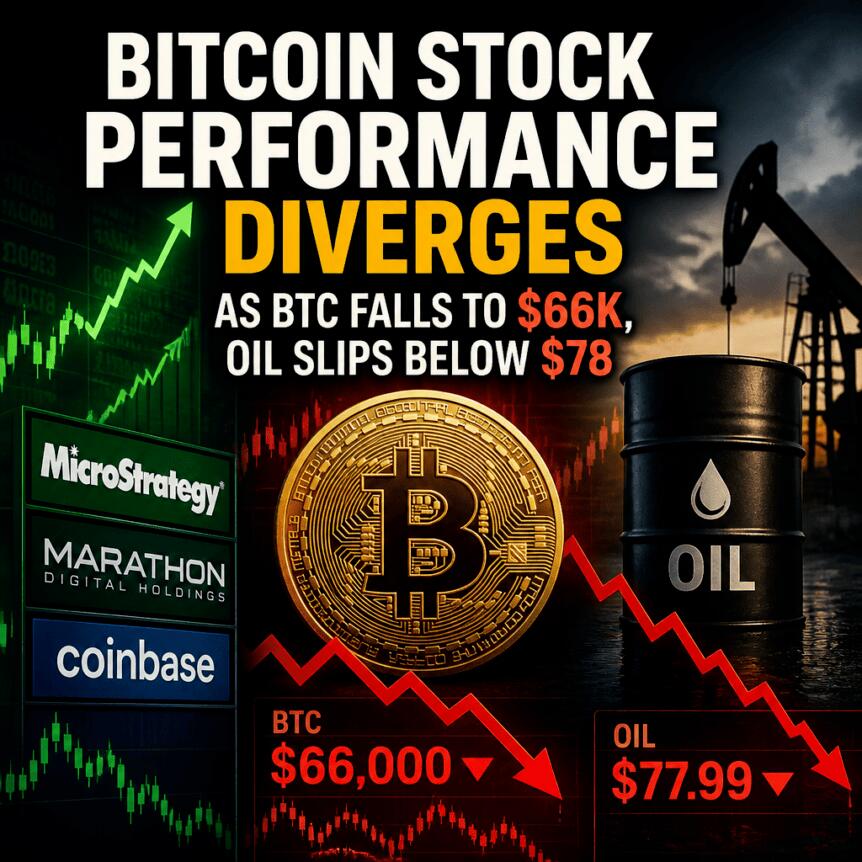
Bitcoin retreated to around $66,000 after Tuesday’s Wall Street open as broader equity markets pushed higher. The move underlined a growing split between crypto and traditional risk assets, even as a reported U.S.–Iran peace development supported stocks and weighed on crude oil.
While U.S. WTI crude slid to three-month lows—a backdrop that typically benefits risk sentiment—traders appeared unwilling to press fresh bullish bets on BTC. Multiple analysts pointed to $70,000 as the key upside area for this leg, while others argued that the market may be entering a sell zone or even getting “lured” into positions that fail to materialize.
According to TradingView data cited in earlier market commentary, BTC’s price action cooled after it had reached its highest level in nearly two weeks. The broader risk-off/risk-on picture appeared mixed: investors pushed into equities after headlines around U.S.–Iran peace plans, while crude oil weakened sharply.
In its latest newsletter The Market Mosaic, Mosaic Asset Company said that confirmations from both sides and other negotiation parties were contributing to a spillover effect in markets. The firm connected the drop in energy prices to a tailwind for equities, pointing to the usual dynamic where oil and longer-dated bond yields fall together—factors that can reinforce stock momentum.
“That’s leading to a spillover effect in the stock market, where oil prices and longer-dated bond yields are both pulling back. A negative correlation between stocks and oil prices means the drop in energy prices is a tailwind for equities.”
Despite the equity-led optimism, Bitcoin showed what traders described as divergence from other risk assets. Daan Crypto Trades wrote on X that BTC had moved back “into its range,” adding that he would not be surprised to see consolidation for “a few more weeks at least,” especially as summer typically brings lower liquidity and volatility.
“I would not be surprised if we hang around this big area for a few more weeks at least. Especially with Summer coming up and lower liquidity/volatility.”
Another trader, Roman, similarly framed $70,000 as the level to watch for completing a bounce. In his X post, he said he was “still eyeing the 70k level for our bounce to be completed,” while noting that hourly timeframes looked favorable and that there were no apparent issues to stop the move.
“Still eyeing the 70k level for our bounce to be completed.”
That combination—range expectations plus a defined upside target—helps explain why BTC could slip even while other markets advanced. In practice, traders appeared more focused on near-term technical levels than on extending directional exposure.
Some market analysis has questioned whether $60,000 is truly strong long-term support, with Cointelegraph earlier reporting that the bear market may still be too young to conclude a full reversal. That critique contrasts with the more tactical approach from other traders who emphasized how order-book dynamics and liquidity can shape short-term price behavior.
Killa, for example, suggested that market makers and trading algorithms may have encouraged traders to bet on lower lows that never arrive, characterizing the pattern as a “market psyop.” In the same line of discussion, he referenced order-book liquidity data.
“Just another classic market psyop,” they summarized alongside a chart of order-book liquidity data.
Derivatives activity added another layer to the caution around follow-through. According to CoinGlass liquidation data, crypto saw $230 million in short liquidations over the prior 24 hours at the time of writing.
Liquidation events can be double-edged for traders. While they may clear crowded positions and relieve downward pressure temporarily, they can also signal that leverage was aggressively harvested—after which price can stall or reverse as new buyers hesitate.
Lennaert Snyder pointed to this type of dynamic in his commentary. He said price was entering a “high-time frame sell zone,” and he referenced $68,000 as the target for Tuesday. Snyder added that liquidity below 63.6K looked “too juicy” to avoid, but he preferred a push upward first for a “quality short,” suggesting he was waiting for a better entry rather than chasing immediate downside.
“The liquidity sub 63.6K looks too juicy to not mitigate, but for the quality short I’d prefer that push to the upside first,” he wrote.
Looking ahead, traders are likely to monitor whether BTC can break through $70,000 with sustained momentum—or whether liquidation-driven flows and “sell zone” expectations cap the rebound. With equities supported by macro headlines and oil acting as a changing variable for risk sentiment, the key uncertainty is whether crypto can align with broader market direction, or continue trading as a more self-contained range where liquidity dictates the next move.
This article was originally published as Bitcoin Stock Performance Diverges as BTC Falls to $66K, Oil Slips Below $78 on Crypto Breaking News – your trusted source for crypto news, Bitcoin news, and blockchain updates.