The bitcoin market pauses after its surge above 82,000 dollars. On September 6, its price moves around 80,000 dollars, in a narrow zone where buyers and sellers neutralize each other. However
The bitcoin market pauses after its surge above 82,000 dollars. On September 6, its price moves around 80,000 dollars, in a narrow zone where buyers and sellers neutralize each other. However, the rise observed since late August maintains solid technical foundations. The price remains above the main daily moving averages, while weekend volumes drop sharply. This configuration now places the market facing several key levels before any new sustained acceleration.
In brief
- The price moves around 80,000 dollars, after failing to sustainably break above 82,000 dollars.
- The 79,586–80,147 dollar zone is the main short-term support to watch.
- Moving averages remain favorable, with the price still above the main daily indicators.
- Oscillators and low volume show a slowdown in momentum after the September 3 peak.
- Oscillators and low volume show a slowdown in momentum after the September 3 peak.
Bitcoin: resistance remains firmly present around 82,000 dollars
After a particularly volatile week for Bitcoin, the market now moves into a waiting phase. Around 9:30 am on September 6, the price ranges between 79,750 and 80,100 dollars as shown on the BTC/USD hourly chart—Bitstamp on TradingView below. Hourly candles remain small and overlap since the strong progression observed on Friday. This evolution reflects a temporary balance between buyers and sellers.
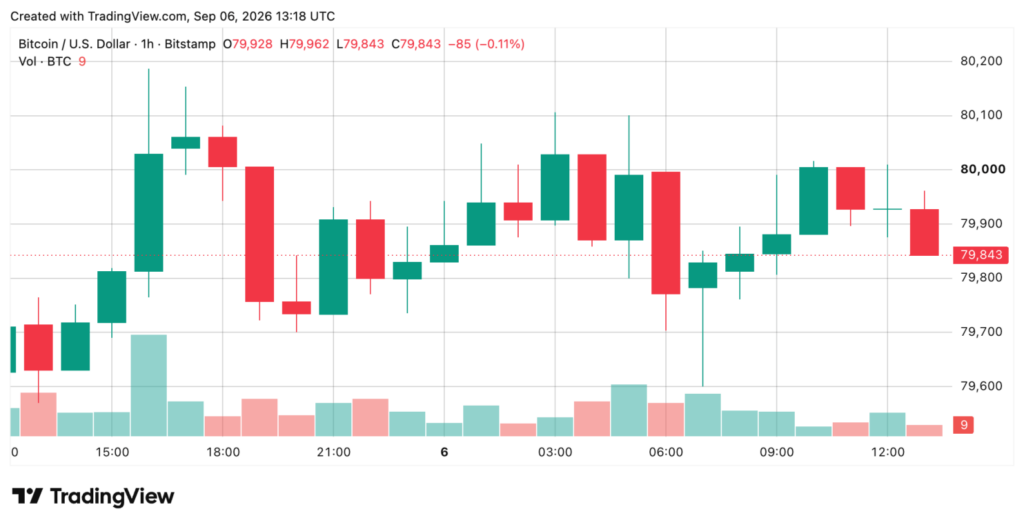 Bitcoin moves below 80,000 dollars, with visible resistance around this key threshold. Source: TradingView
The decline in volumes reinforces this impression of caution. Trades made on Saturday and Sunday remain well below levels observed on September 3 and 4. This drop corresponds to the usual weekend rhythm but also limits the scope of recorded movements. A significant variation in a low-liquidity market does not necessarily provide a lasting confirmation.
The immediate battle focuses on a range of a few hundred dollars. The intraday zone extends precisely from 79,586 to 80,147 dollars. A confirmed break above 80,147 dollars could push the bitcoin price toward 80,335 dollars, then 80,523 dollars. Conversely, a break below 79,586 dollars would place 78,650 dollars as the next technical target.
This situation explains the importance of volumes in the coming hours. A breakout from the current zone without notable trading volume would remain difficult to interpret. Operators must therefore simultaneously monitor the price and market activity. For now, no camp manages to clearly regain the upper hand.
Your 1st cryptos with BinanceThis link uses an affiliate program.Bitcoin slows down after the strong rise at the beginning of September
The four-hour analysis helps better understand the current slowdown. The market rose sharply on September 3 before reaching a zone between 81,400 and 82,200 dollars. This rise then encountered significant resistance. On September 4, a quick correction brought the price back toward 78,000 dollars.
The following sessions then established a stabilization phase. The price moved between about 79,500 and 80,200 dollars during the next two sessions. At the same time, the range of fluctuations decreased. Volume also declined, confirming the change of pace after the early-week surge.
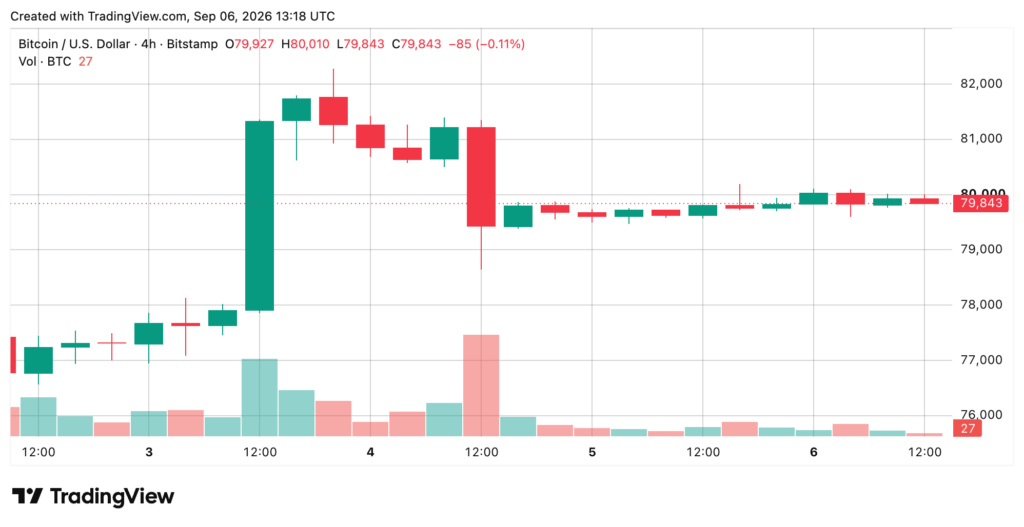 BTC/USD chart on 4 hours via Bitstamp. Source: TradingView
 The price currently sits around the middle of this range. The zone from 79,900 to 80,100 dollars has concentrated a large part of recent trades. This position particularly indicates stabilization after the failure to break resistance. It does not yet signal a new upward phase.
The next four-hour close therefore becomes decisive. A close below 79,586 dollars could open a move toward 78,650 to 78,700 dollars. Conversely, buyers must achieve a close above 80,335 dollars, then 81,430 dollars. These levels would confirm a new test of the peak reached on September 3.
The daily trend retains several supports
On the daily chart, the general structure remains stronger despite the recent pause. The market had established a consolidation base between 58,000 and 64,000 dollars in mid-summer. Progress then accelerated at the end of August. The price ultimately reached about 82,239 dollars on September 3.
The pullback on September 4 did not cancel this upward trend. The days of September 5 and 6 mostly show reduced volatility. On Sunday, the price opened at 79,830 dollars, reached 80,106 dollars, touched 79,600 dollars, and then displayed 79,910 dollars. These levels show a recovery that maintains structure but that now crosses a pause phase.
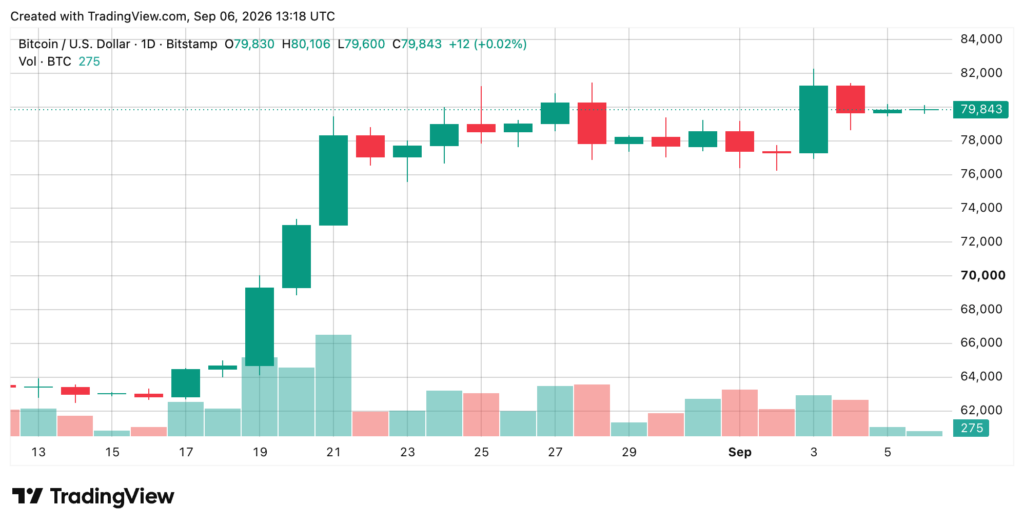 Daily BTC/USD chart via Bitstamp September 6, 2026. Source: TradingView
The price also remains above the 10- and 20-day moving averages. These stand respectively at 78,771 and 77,231 dollars. This position maintains a favorable framework on the daily chart. However, the reduced volume limits the interpretation of this short-term analysis.
Trades over 24 hours currently reach 20.21 billion dollars. This amount remains well below the 35 to 40 billion recorded on September 4 and 5. A new test of the resistance between 80,335 and 82,239 dollars remains possible. However, current data show more of a slowdown than a new acceleration of the trend.
Oscillators indicate a cooling of momentum
Daily technical indicators present a more mixed situation. According to CoinLore data, the RSI reaches 66.71 at the time of writing, a high level but still below the classic overbuy threshold set at 70. The stochastic is around 62, while the CCI reaches 65.77. The ADX shows 47 Sunday morning, while the Awesome Oscillator reaches 7,714.
These indicators remain considered neutral overall. The ADX confirms, however, that the trend retains some persistence. Despite this element, the overall reading includes two bearish signals, nine undecided signals, and no bullish signals. This distribution shows that indicators do not yet confirm a new acceleration.
Momentum provides an additional caution signal. The momentum oscillator displays -379, while the MACD is at 3,230 with a bearish reading. These two indicators correspond to the pullback observed after the September 3 peak. They thus show that the speed of progress has weakened since the recent peak.
This divergence between price structure and momentum deserves particular attention. The market retains several technical supports, but momentum indicators remain less favorable. A new increase would thus need additional confirmations. Without these, consolidation around 80,000 dollars can continue.
Moving averages maintain a favorable orientation
Moving averages present a different reading from oscillators. The exponential moving averages at 10, 20, 30, 50, 100, and 200 periods all show bullish signals. Simple moving averages also follow this orientation. Bitcoin’s price thus remains above each of the main daily moving averages.
The indicator dedicated to moving averages lists 13 positive signals, one neutral signal, and one bearish signal. This configuration thus offers a globally favorable framework. It explains why the daily structure remains stable despite the momentum slowdown. However, it alone is not sufficient to confirm a new peak.
The Hull moving average is the main immediate obstacle. It stands at 80,523 dollars, just above the current price. This average adds extra resistance in an area already marked by several technical levels. Breaking this reference could therefore reinforce the reading of a recovery.
Below the market, several averages form an important support zone. The 20-period SMA is at 77,208 dollars, while the 20-period VWMA reaches 76,714 dollars. The 20-period EMA is at 76,416 dollars. A daily close below this ensemble would change the currently favorable structure.
Key Bitcoin levels to watch
In the short term, two zones concentrate most attention. Above the price, the zone from 80,335 to 82,239 dollars groups several important resistances. Below the market, the zone from 79,586 to 78,650 dollars constitutes the first technical area to watch. A confirmed breakout from one of these two zones would better define the next direction.
The more distant support is around 76,200 dollars. The psychological zone of 75,000 dollars then constitutes another marker. These levels allow measuring the potential magnitude of a possible downward movement. They thus complement the structure observed around daily moving averages.
The derivatives market also provides an additional indication. Call options currently represent 61.69% of open positions according to Coinglass data. Put options represent 38.31% of open positions. On Binance, the level of maximum sensitivity is around 70,000 dollars, while the following expirations roughly range from 60,000 to 80,000 dollars.
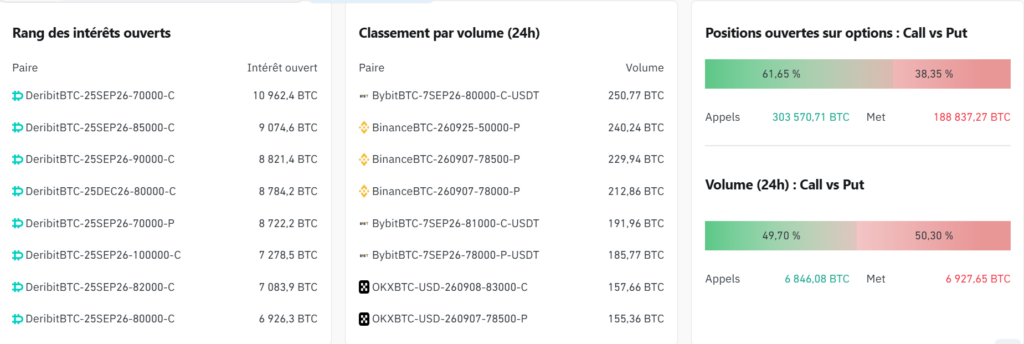 Calls dominate open positions at 61.65%, while puts represent 50.30% of 24h volume. Source: Coinglass.
This configuration alone does not allow determining the market’s next direction. Derivatives complement price, volume, and technical indicator data. For now, these elements show a still balanced situation in the short term. The next breakout will therefore need to be accompanied by higher volumes to gain reach.
The market thus retains a favorable daily structure, but immediate momentum remains fragile. Breaking 80,335 and then 81,430 dollars would strengthen the possibility of a new test of the September 3 peak. Conversely, a break below 79,586 dollars would put 78,650 dollars back at the center of analysis. Between these levels, consolidation can still continue.
In the short term, BTC‘s trajectory will therefore mainly depend on the next closes and volume evolution. A recovery of trades would ideally accompany any attempt to break resistances. Otherwise, the market could maintain lateral movement around 80,000 dollars. The next direction will thus remain conditioned by the price’s ability to sustainably exit its current range.