Key Highlights Bitcoin trades at $55,761 — down 9.93% in 24 hours — after Alphractal's Alpha Footprint flagged aggressive whale selling at $58,500 Orders in the $1M–$10M and above-$10M bracke
Key Highlights
Bitcoin trades at $55,761 — down 9.93% in 24 hours — after Alphractal's Alpha Footprint flagged aggressive whale selling at $58,500
Orders in the $1M–$10M and above-$10M brackets show substantial aggressive sell spikes with zero sustained buyer absorption per Alphractal data
Dense liquidation clusters identified in the $55,000–$52,000 zone are now directly in play as price enters that range
Bitcoin is trading at approximately $55,761 — down 9.93% over the past 24 hours — and on-chain order flow data is flashing a warning that goes beyond ordinary price volatility. The selling pressure gripping this decline is not concentrated in retail panic. It is coming from the top of the size ladder.
An analyst at Alphractal published an Alpha Footprint breakdown on November 20, 2026, when Bitcoin was still near $58,500 — before today’s further leg lower to $55,761. The finding was precise: aggressive sell orders are appearing across every bracket above $10K, with the heaviest concentrated in the $1M–$10M and above-$10M whale tiers. No sustained buyer absorption has emerged to offset the flow.
The Alpha Footprint is an order-flow analytics tool that segments executed trades by order size, tracking whether each bracket — retail, mid-size, and institutional — is hitting the bid (selling aggressively) or lifting the ask (buying aggressively). It is not an indicator derived from price or volume alone. It reads the actual aggressor side of each fill, then separates that signal by dollar bracket. The result is a layered picture of who is driving price at any given moment.
This distinction matters. Standard volume charts collapse all participants into a single bar. The Alpha Footprint separates a $500 retail trade from a $5 million institutional block — and right now, the two cohorts are pointing in opposite directions.
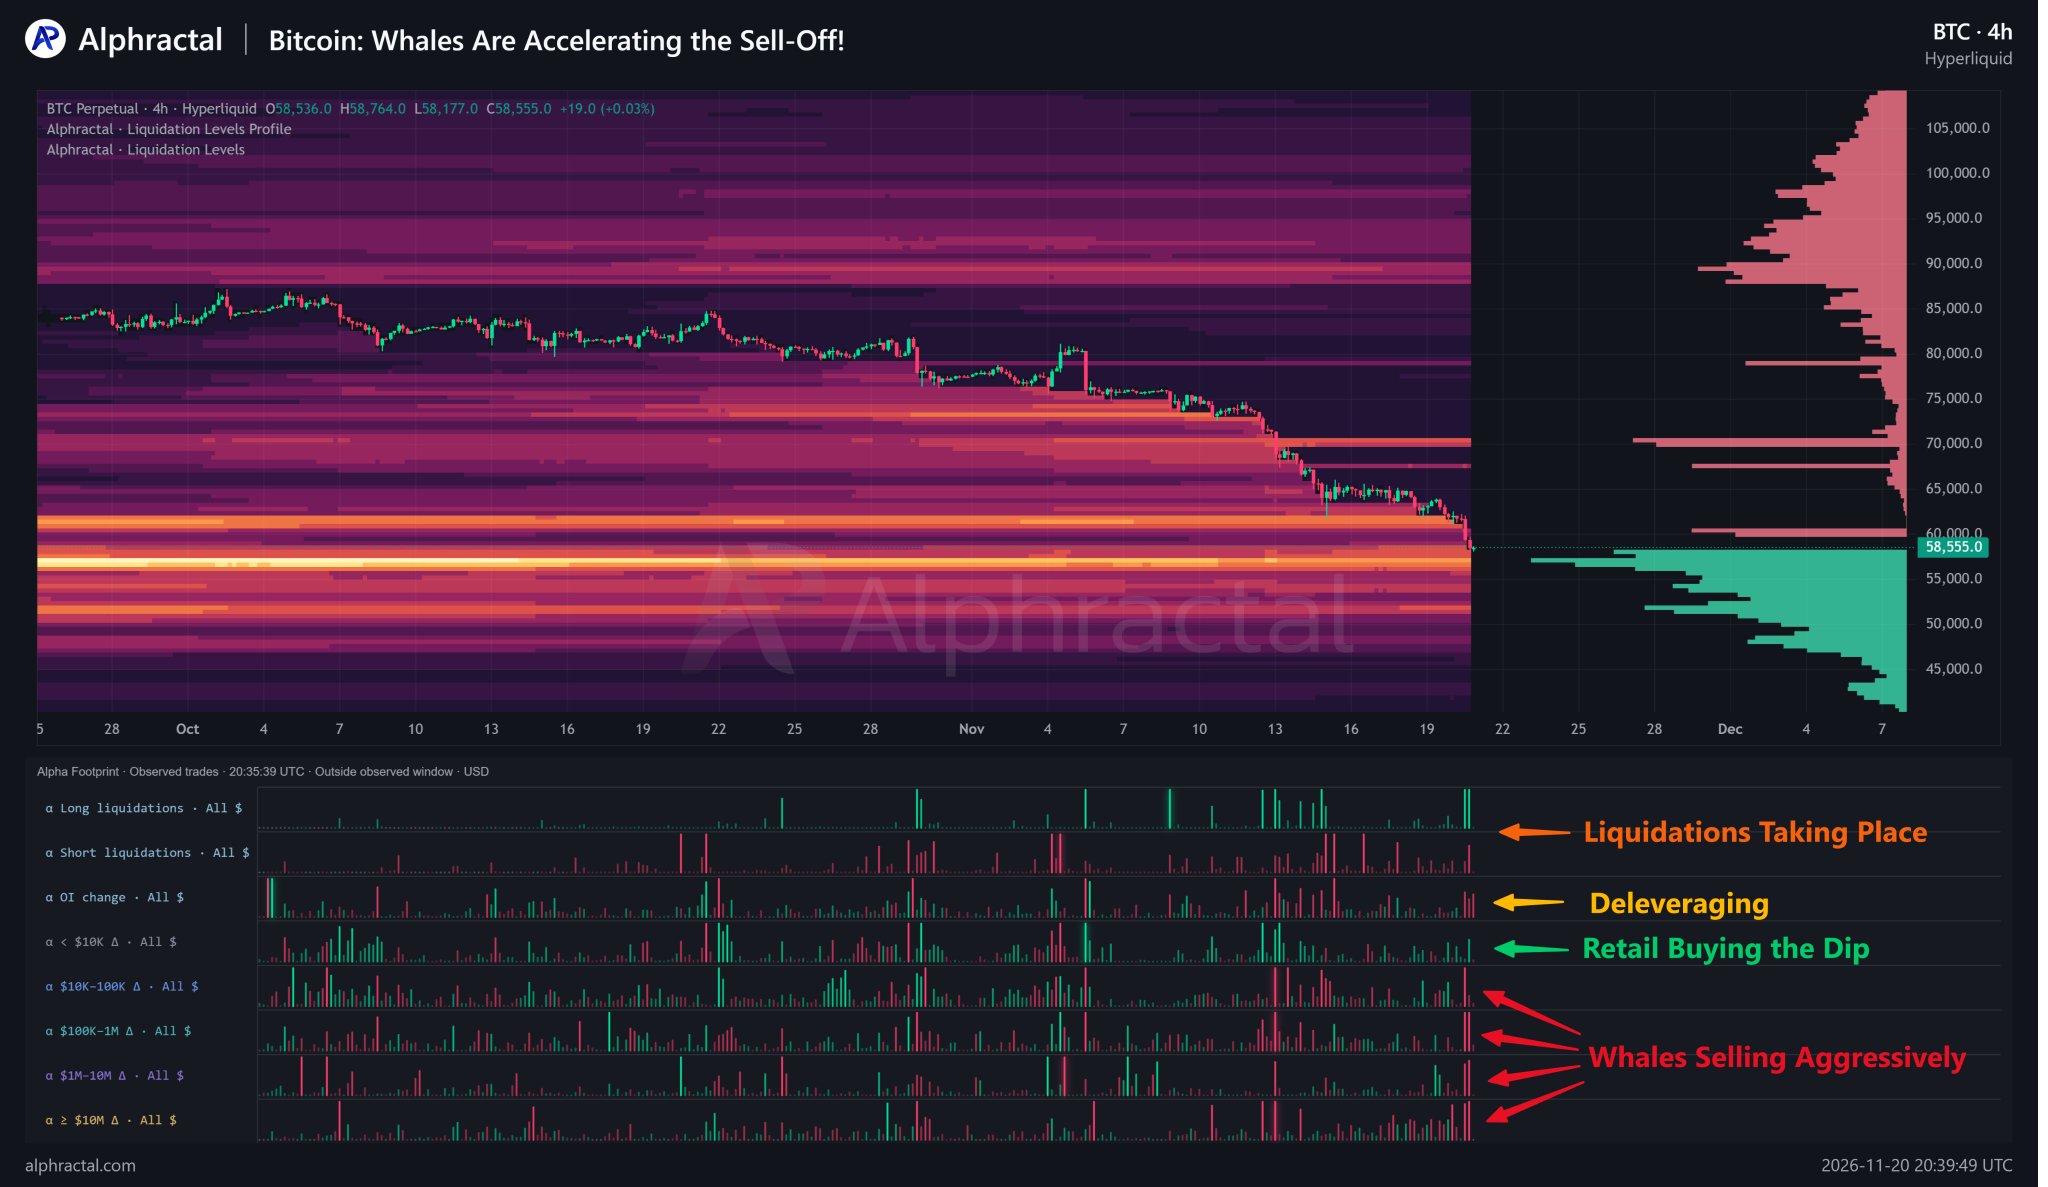
Bitcoin PERP 4H Chart Analysis | Source: @Alphractal (X)
The Alphractal breakdown segments the market into five order-size tiers. Here is what the data shows across each:
Order Size Bracket
Current Signal
Characterization
Under $10K (retail)
Mixed, weak buying
No directional conviction
$10K–$100K
Intensifying sell pressure
Mid-size traders exiting
$100K–$1M
Intensifying sell pressure
Institutional-adjacent selling
$1M–$10M
Substantial aggressive sell spikes
Large whale distribution
Above $10M
Substantial aggressive sell spikes
Largest whale distribution
Source: Alphractal Alpha Footprint, November 20, 2026
The divergence at the top and bottom is structurally significant. Retail traders — orders under $10K — are showing mixed signals, the kind of indecision that characterizes participants who are uncertain rather than positioned. But every bracket above that threshold is registering aggressive sell-side activity, with the two largest tiers showing the most pronounced negative delta spikes in the data.
Aggressive selling alone does not guarantee continued price decline. What transforms a sell-side signal into a bearish structural read is the absence of a counterforce. In order-flow analysis, that counterforce is buyer absorption — large resting buy orders that accept the aggressive selling and prevent price from moving lower.
According to the Alphractal analysis, no sustained buyer absorption has materialized at current levels. The aggressive sell orders from the $1M–$10M and above-$10M brackets are not being absorbed. They are moving price. That dynamic, combined with the open interest changes the data captures — consistent with deleveraging and position closures rather than new short-side positioning — describes a market where leveraged longs are being forced out and no large-scale buyer has stepped in to catch the flow.
The 4-hour chart on Hyperliquid’s BTC perpetual market reinforces this read. The liquidation heatmap shows dense horizontal clusters in the $55,000–$52,000 zone — a range now directly in play given the move from $58,500 at the time of Alphractal’s post to $55,761 at time of writing. The right-side market profile shows heavy sell-side volume overhead and lighter buy-side accumulation below current price, consistent with the order-flow data. This broader altcoin weakness context is also reflected in TOTAL2 losing its June low, where the macro altcoin structure is under comparable pressure.
Retail-driven sell-offs have a recognizable profile: small-order negative delta, liquidation cascades from over-leveraged longs, and rapid recovery once the leveraged positions are cleared. The bounce follows quickly because no structural seller has committed capital to the downside — the market falls on forced exits, not conviction.
What the Alpha Footprint is describing is different. The $1M–$10M and above-$10M brackets represent participants with enough capital to either sustain a directional position or absorb a move if they chose to. When those brackets are the aggressive sellers — not the buyers — it means the entities capable of providing absorption are instead providing supply. That is a qualitatively different market condition.
Simultaneously, open interest data captured in the Alphractal note shows ongoing deleveraging. This is not new short exposure being added — it is existing long exposure being removed. The combination of whale selling, no absorption, and position closures across the size spectrum describes a market in active distribution, not consolidation. XRP is experiencing comparable structural pressure, where the $0.99 channel support has broken under similar broad market conditions.
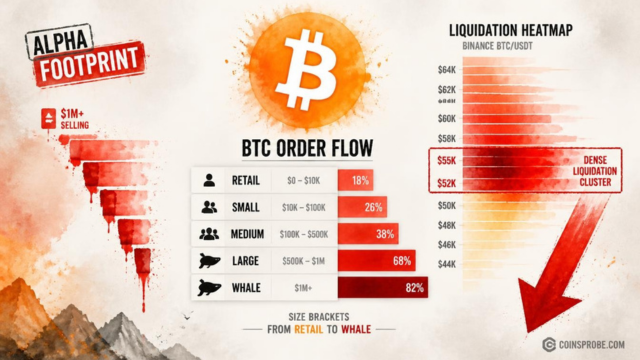
The Alphractal chart identifies a dense liquidation cluster sitting in the $55,000–$52,000 range. Bitcoin is now trading at $55,761 — sitting at the upper boundary of that zone. Liquidation clusters function as gravitational targets during deleveraging: as leveraged long positions are forcibly closed, the cascade of sell orders pulls price toward the highest concentration of remaining stop-loss and liquidation triggers.
With no buyer absorption confirmed at current levels and whale-tier selling still active per the latest order-flow data, that $52,000 lower boundary of the cluster represents the next quantified risk zone. The metric to track is straightforward: does large-bracket buying — specifically $1M–$10M and above-$10M order flow — shift from net aggressive selling to net aggressive buying? Until that flip registers in the Alpha Footprint, the structural read remains bearish.
The 24-hour trading volume of $61.5 billion — data via CoinGecko — confirms this is not a low-liquidity event. The move is happening in a fully liquid market, which makes the absence of large-bracket buyer absorption more meaningful, not less.
Bitcoin’s market capitalization stands at approximately $1.12 trillion at time of writing. The Alpha Footprint data from Alphractal puts the current decline in structural context: this is a whale-led distribution event with no confirmed absorption floor, active deleveraging across the order book, and a dense liquidation cluster between $55,000 and $52,000 directly ahead. Watch $52,000 — a sustained move below that level would clear the identified liquidation cluster and open air below with no documented support from the current order-flow data.
Disclaimer: The views and analysis presented in this article are for informational purposes only and reflect the author’s perspective, not financial advice. Technical patterns and indicators discussed are subject to market volatility and may or may not yield the anticipated results. Investors are advised to exercise caution, conduct independent research, and make decisions aligned with their individual risk tolerance.
Also Read: TOTAL2 Loses June Low — Analyst Revives Macro Double Bottom Thesis