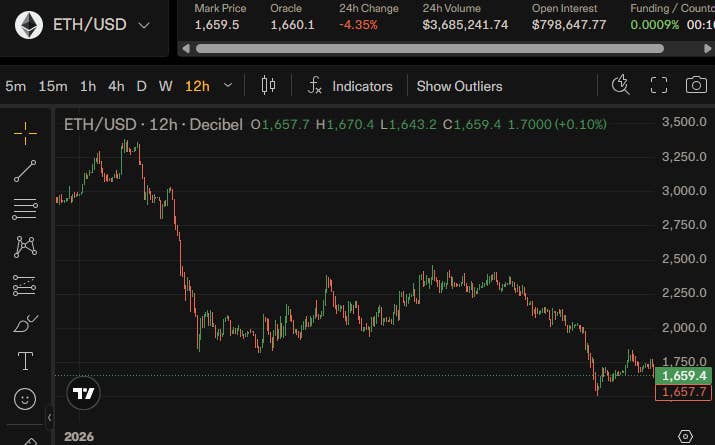
The Bitcoin price fell 3.89% in the last day, down to $62,649.88. A risk-off wave hit global markets, and Big Tech sold off hard. That pushed investors out of riskier assets and into safer gr
The Bitcoin price fell 3.89% in the last day, down to $62,649.88. A risk-off wave hit global markets, and Big Tech sold off hard. That pushed investors out of riskier assets and into safer ground.
Crypto took a heavier hit than equities, with Bitcoin maintaining a 97.6% correlation with the S&P 500 during the move. The decline was amplified by a leverage flush that wiped out more than $163 million in Bitcoin positions, most of them longs.
Also, U.S. spot Bitcoin ETFs continued bleeding capital, adding fresh selling pressure. Yet beneath the surface, blockchain data points to a very different story unfolding among the market’s largest holders.
Bitcoin ETF Outflows Hit $4 Billion as Whales Step In
The Bitcoin price is facing one of its toughest demand tests since spot ETFs launched. Crypto analyst BATMAN pointed out that Bitcoin ETFs have seen about $4 billion leave in the last month. To put that in perspective, the whole previous quarter only had $3 billion in outflows. So institutional selling has picked up fast in a short time.
Under normal circumstances, this level of ETF selling would push the Bitcoin price much lower. ETFs hold actual BTC, meaning redemptions often translate into coins entering the open market. Combined with weak sentiment and falling equity markets, the setup appeared ideal for a deeper correction.
However, blockchain activity reveals another force absorbing that supply. Analyst CW reported that Bitcoin accumulation addresses recorded their largest single inflow of this market cycle. Accumulation addresses are wallets that consistently receive BTC without meaningful spending activity.
The pump indicates that large investors and whales are purchasing coins at a pace sufficient to absorb much of the selling coming from ETFs and retail participants. That helps explain why the Bitcoin price continues holding above the $60,000 area despite billions of dollars leaving investment products.
Gann Cycle Chart Points to a Potential Final Bitcoin Shakeout
A chart shared by analyst GeoMetric offers another interesting perspective on where the Bitcoin price may be headed next. The chart uses Gann-based time analysis from Bitcoin’s 2011 low. It does not focus on price levels. Instead, it maps out historical cycle timing and spots recurring periods where major trend changes happened in the past.
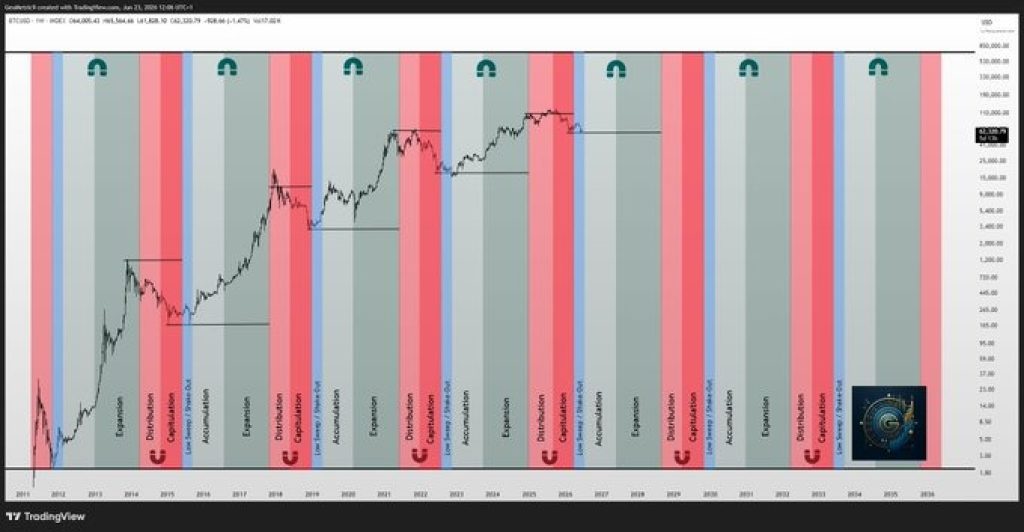 Source: X/GeoMetric
The blue zones on the chart mark windows where previous cycle lows got one final sweep before the next big move up. Looking back, similar periods showed up near important bottoms in 2015, 2018, and 2022. Each time, Bitcoin dipped one last time before a much larger recovery took off.
What makes the chart interesting is that GeoMetric says the framework came from a single historical anchor point and was projected forward using Gann ratios and geometric scaling. The current cycle is now entering another blue-window period. If the pattern holds, Bitcoin could be in the final stage of a shakeout, designed to flush out weaker holders before the next leg up begins.
Related Bitcoin News: Is the Bitcoin Crash Over? Claude AI and ChatGPT Both Weigh In
What Happens Next for Bitcoin Price?
The key zone right now is $60,000 to $63,000. Big players are buying, accumulation addresses are filling up, and the market is soaking up ETF outflows without breaking down.
That tells you larger investors like these prices. If the buying keeps up, Bitcoin could get back to $67,000–$70,000 once the broader market settles down.
Also, the Gann cycle framework leaves room for one more sweep lower. A move toward the upper-$50,000 region cannot be ruled out if risk assets remain under pressure and ETF outflows continue.
Even so, as long as large holders keep absorbing supply and accumulation trends remain intact, any final dip may end up serving as the last major shakeout before Bitcoin attempts a fresh run toward its cycle highs.
Frequently Asked Questions
What could send the BTC price lower
Failure to hold support around $60,000 could open the door to deeper retracements toward lower support levels identified on the chart.
Why did Bitcoin crashBitcoin fell alongside a sharp drop in U.S. and Asian equities, particularly the KOSPI’s 10% crash. Over $150 million in longs were liquidated, accelerating the selloff.
Subscribe to our YouTube channel for daily crypto updates, market insights, and expert analysis.
The post Bitcoin Whales Just Bought the Biggest BTC Price Dip of This Cycle appeared first on CaptainAltcoin.

 (@CryptosBatman)