A quiet DeFi token just turned into the loudest chart in the room, and traders who bet against it are finding out the hard way what happens when a crowded short position meets a sudden wave o
A quiet DeFi token just turned into the loudest chart in the room, and traders who bet against it are finding out the hard way what happens when a crowded short position meets a sudden wave of buying. Nobody saw a listing headline coming. What they got instead was a candle that broke months of sideways grinding in a single session, the kind of move that makes people who were laughing at the coin last week start refreshing their portfolio every ten minutes.
Searches for Bitway price prediction have spiked overnight, and it's not hard to see why once you look at what just happened on the chart. A coin that spent weeks going nowhere suddenly ripped higher, catching a lot of short sellers leaning the wrong way at exactly the wrong time. Turns out, the move wasn't random. This follows a pattern similar to what played out inBitway's futures listing surge just weeks earlier.
A yield campaign push from the project's own team landed right as broader market sentiment turned risk-on, and that combination lit the fuse. Shorts got squeezed. Hard. And once the forced buying started, it fed on itself, pulling in momentum traders who didn't want to miss the next leg.
Here's the thing: none of this happened because of a listing announcement or a big partnership reveal. It happened because positioning got crowded on one side of the trade, and the market punished it. When we pulled up the liquidation data, the pattern was almost too clean, shorts eating the overwhelming majority of losses in every window checked.
So where does Bitway price prediction sentiment stand now, and can this rally actually hold?
Table of Contents
Key Takeaways
Token Contract
Where BTW Stands Right Now
What's Driving BTW's Price Today
Technical Analysis
The Short Squeeze, In Real Time
Tokenomics and Holder Concentration
Liquidity and Exchange Volume
Bull, Base, and Bear Scenarios
Price Forecast Table
Key Risks
Glossary
Key Takeaways
BTW trades near $0.108 as of the latest snapshot, up more than 52% in 24 hours, with the weekly candle up almost 48%.
The 4-hour chart broke out of a range with RSI at 81.57, deep in overbought territory.
Weekly RSI reads 70.64, bullish but with more room left than the 4-hour timeframe.
Immediate 4-hour resistance sits at $0.1158, then a zone near $0.150 to $0.155. Support sits near $0.0716 to $0.0681, then $0.0486.
Liquidations hit $251.44K over 24 hours, and shorts took the overwhelming share in every window, from one hour out to a full day.
Circulating supply is just 2.2B BTW against a 10B total and max supply, a heavy overhang most tokens don't carry this early.
One unlabeled wallet holds 7.8B BTW, 78% of total supply, almost exactly matching the token's non-circulating balance.
Token Contract
Contract Address: 0x3A63DE3572c69a1307ff08394f3Ee7702C16d25d
Standard: BEP-20
Security Rating: CertiK 4.2 / 5
Where BTW Stands Right Now
BTW last changed hands around $0.108, up roughly 53% over the past 24 hours depending on the venue checked. The intraday range ran from a low of $0.0698 to a high of $0.1048, a range visible onBTW's CoinMarketCap listing.
Volume over that window came in near $22.8M against a market cap of $235.75M, a vol-to-market-cap ratio under 9%. Thinner turnover than the price move alone would suggest, a contrast worth noting next toBitcoin's 2026 price outlook, where liquidity runs far deeper.
Total and max supply sit at 10B BTW, with circulating supply at just 2.2B. That leaves 78% of supply still outside circulation, a much bigger overhang than more mature tokens carry.
The all-time high, $0.1903, was set about a month ago. Price now sits roughly 44% below that peak, even after this rally. And the all-time low, $0.007687, was hit about five months back. Current price sits more than 1,263% above that floor.
The chart does not lie.
What's Driving BTW's Price Today
There's no single listing headline behind this move. Bitway's own team pushed a new yield campaign on social media just days ago, promising capital-protected, guaranteed base returns through a product called Bitway Earn, farmable directly through Binance Wallet. Theannouncement went out on X days before the squeeze accelerated.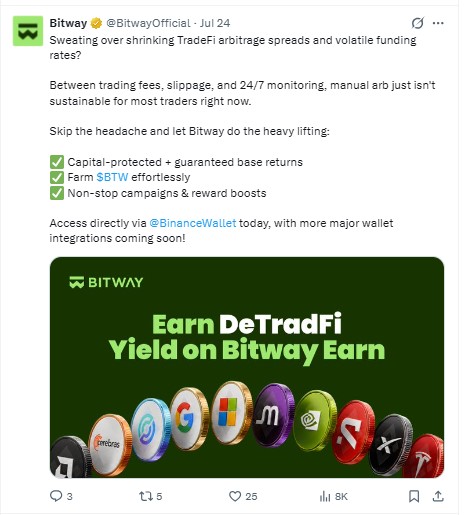
Guaranteed-returns marketing tends to pull in fresh buyers fast, whether the promise holds up long-term or not. Layer a broader risk-on mood across crypto onto that, and the setup for a sharp move was already stacking up before the liquidation cascade even started. The staking mechanics here echo what we covered in Bitway's Binance Wallet staking rollout.
But the campaign alone doesn't explain a move this size. Crowded short positioning did the rest.
Technical Analysis
4-Hour Chart
Price broke out of a tight range that had held for weeks, running from an open near $0.0992 to a high of $0.1074 before settling around $0.1047, a move visible onTradingView's BTW chart.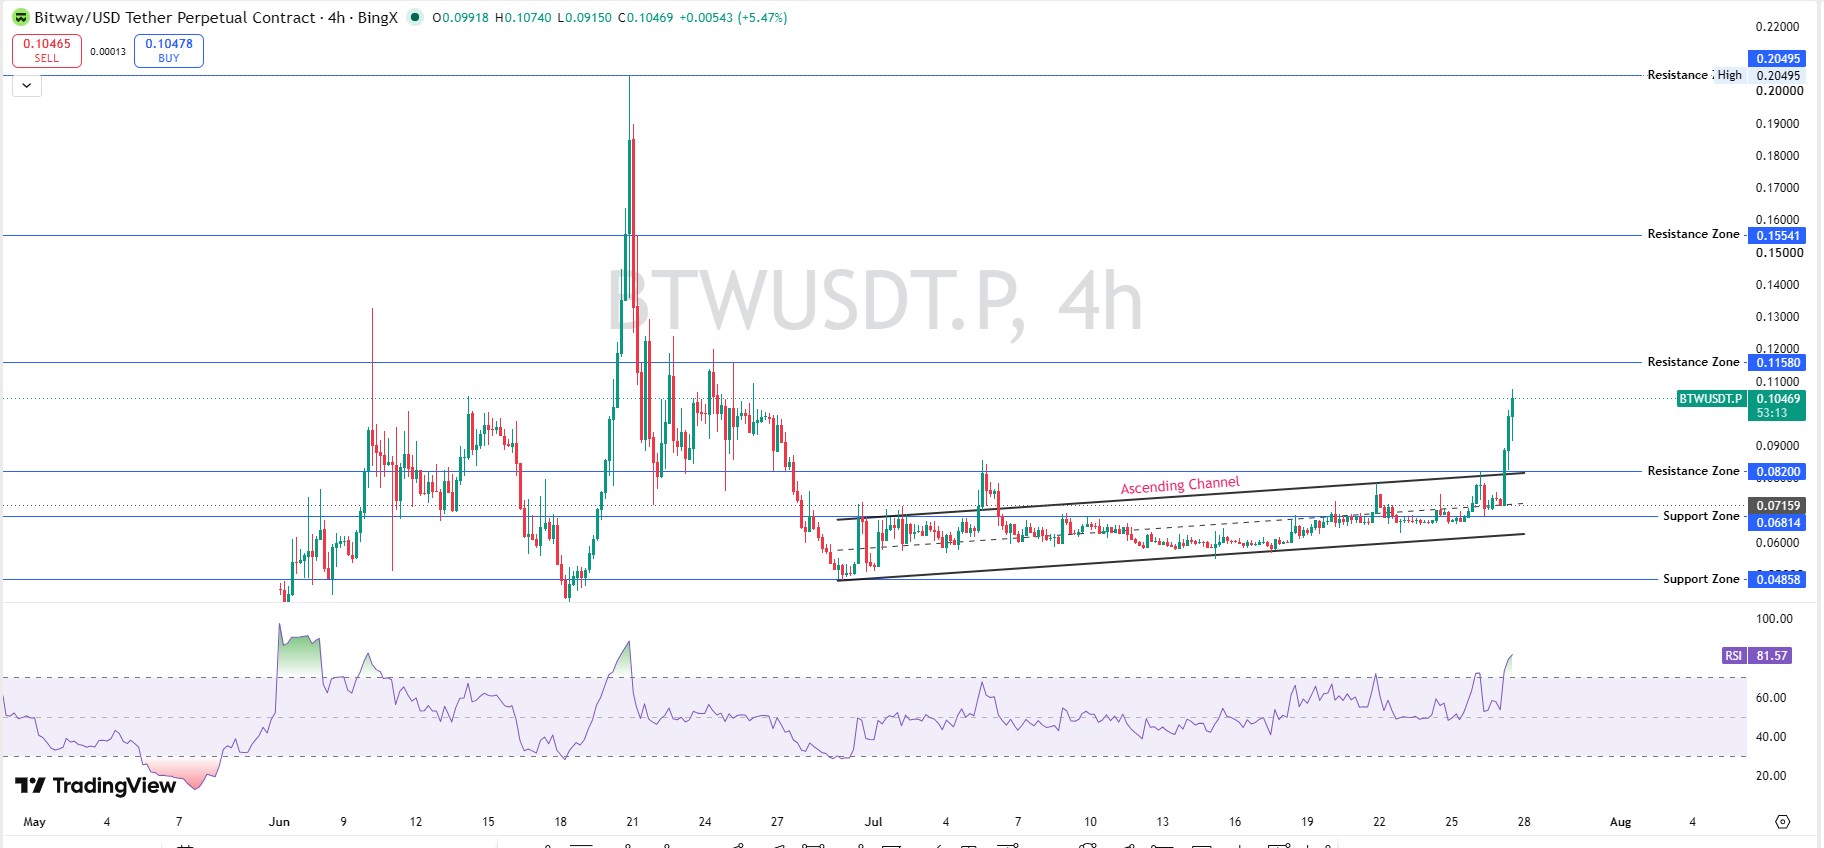
RSI on this timeframe reads 81.57, deep into overbought territory. Resistance sits at $0.1158, then a thicker zone between $0.150 and $0.155. Above that, the prior high near $0.205 looms as the real ceiling, a level mapped out in Bitway's post-surge target levels.
Support underneath sits between $0.0716 and $0.0681, backed by a deeper floor near $0.0486.
Whales noticed first.
Weekly Chart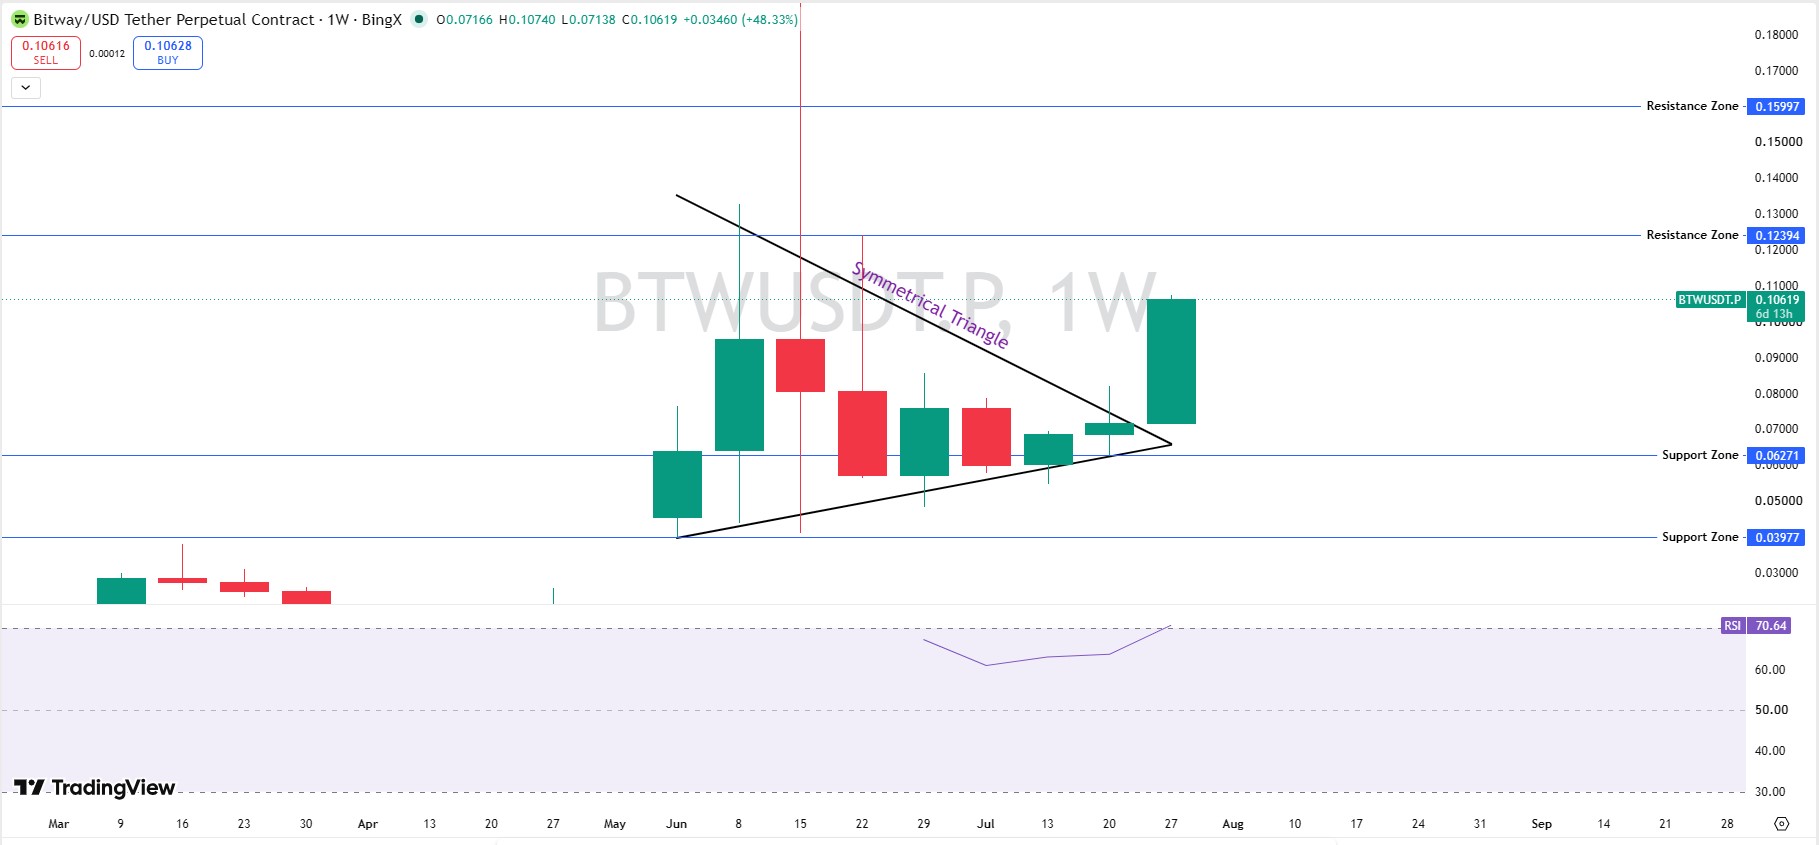
Zoom out and the structure looks different. This week's candle broke clean out of a symmetrical triangle that had been building since spring, closing near $0.1062, up almost 48% for the week. Weekly structures like this tend to matter more for altcoins riding on the back ofEthereum's 2026 trajectory than on short-term noise alone.
When we checked the weekly chart against the 4-hour, the gap between the two RSI readings jumped out fast. Weekly RSI reads 70.64, bullish but nowhere near as stretched as the 4-hour reading. Short-term traders are pushing this move. The bigger structural breakout still has room before it gets genuinely overheated.
Resistance above sits at $0.1239 and then $0.1600. Support below sits at $0.0627 and then $0.0398.
Timing matters here.
The Short Squeeze, In Real Time
Liquidation data tells a clean story, tracked live onCoinglass's BTW liquidation data. Over the last hour, $46.41K got wiped out. Nearly all of it, $46.28K, came from shorts. Longs lost just $130.
Four hours out, the total climbs to $86.00K. Shorts again take the bulk, $58.77K against $27.23K long.
Twelve hours in, $246.82K gone. Twenty-four hours, barely more, $251.44K. Shorts dominate every single window checked.
A classic squeeze signature: forced covering stacked on organic buying, one after another. Traders watching for the next catalyst often check theupcoming coin events calendar to spot the next squeeze setup early.
So how much of this move is real demand, and how much is just short covering feeding on itself?
Tokenomics and Holder Concentration
BTW is a BEP-20 token rated 4.2 out of 5 by CertiK, with holder details visible onBscScan's token holder data. Total and max supply sit at 10B BTW, circulating supply is at 2.2B, a bigger unlock overhang than most tokens carry this early in their lives.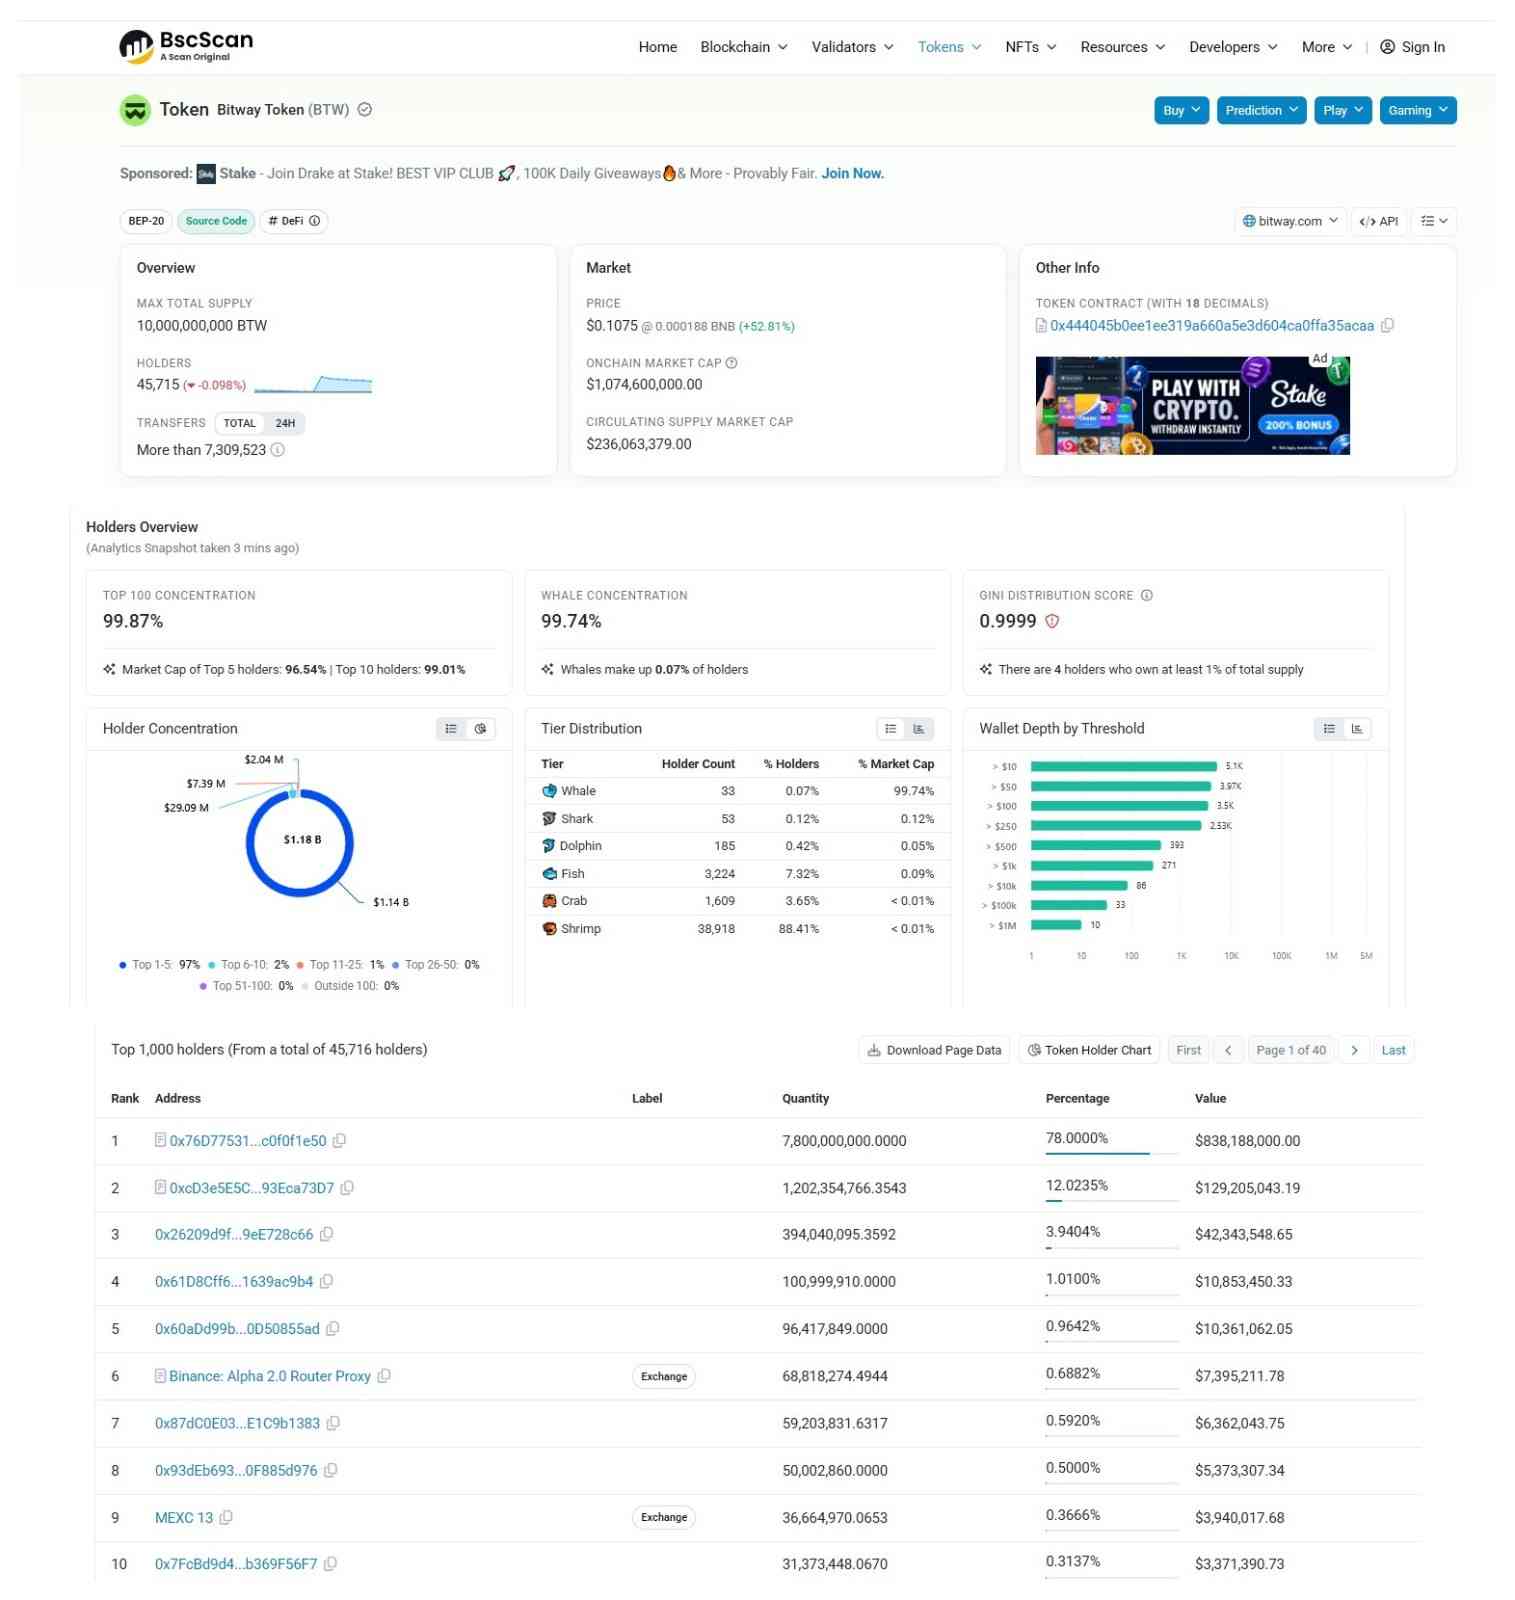
Concentration here isn't just high; it's extreme. Top 100 wallets control 99.87% of tracked supply. Just 33 whale wallets, 0.07% of all holders, control 99.74% of market cap value. The Gini distribution score sits at 0.9999, about as close to maximum inequality as a number gets. Extreme concentration like this isn't unique to BTW either; similar patterns turned up aroundOzak AI's CertiK listing review.
One wallet alone holds 7.8B, BTW, 78% of the total supply. That figure lines up almost exactly with the gap between total and circulating supply, which points to a treasury, vesting, or lock contract rather than a single trader sitting on a fortune. But it's unlabeled, so nobody outside the project can confirm that with certainty.
The second-largest wallet holds another 12.02% of total supply, also unlabeled. Combined, the top two wallets alone hold over 90% of everything that will ever exist.
That's a number worth sitting with for a second.
When we cross-referenced the top ten wallets against exchange labels, only two came back tagged: a Binance Alpha 2.0 router proxy at 0.69% and a MEXC wallet at 0.37%. Both are far smaller than the mystery wallets above them.
Exactly.
Liquidity and Exchange Volume
Liquidity relative to market cap sits at just 0.61%, thin even by small-cap standards. Futures volume, meanwhile, tells a different story about where the real action lives. Binance dominates by a wide margin at $51.68M in 24-hour futures volume, a pattern common across pairs tracked on thecrypto exchange listing hub, with Bybit a distant second at $8.54M.
Bitget, Gate, MEXC, Bitunix, and BingX trail well behind that.
Fine. That kind of single-exchange dominance means margin-driven positioning, not organic spot demand, is doing most of the work behind this move.
Bull, Base, and Bear Scenarios
None of this is financial advice. These are scenario estimates built from current chart structure, not guarantees, and worth reading alongside the latestcrypto market news.
Bull Case:A daily close above $0.1158 opens a path toward $0.1239, then the $0.150 zone, within seven to fourteen days. Probability sits around 30%, contingent on the squeeze extending and weekly RSI pushing further above 70. Invalidation: a daily close back below $0.095.
Base Case:Price consolidates between roughly $0.085 and $0.12 over the next seven to thirty days as the squeeze unwinds. The probability is highest, around 45%. Invalidation: a clean weekly close outside either boundary.
Bear Case: Momentum fades, and price retraces toward the $0.0681 support zone, with a deeper test of $0.0486 possible within thirty days if broader sentiment cools. Probability sits around 25%. Invalidation: sustained volume holding above $0.13 for more than a week.
Price Forecast Table
Timeframe
Bear
Base
Bull
24H
$0.098
$0.108
$0.118
7D
$0.082
$0.110
$0.135
30D
$0.055
$0.100
$0.160
Long Term
$0.035
$0.130
$0.250
These figures aren't guarantees. They're ranges built around support and resistance levels already visible on the chart.
Key Risks
Extreme short-term overbought conditions top the list, with 4-hour RSI above 81 leaving little room before a cooling-off period. A heavy supply overhang remains, with 78% of total supply still outside circulation and concentrated in a single wallet.
Holder concentration is severe across the board, and a Gini score of 0.9999 points to almost no real float outside a handful of addresses. Single-exchange futures dominance means this move is currently margin-driven rather than broad spot accumulation.
And the guaranteed-returns yield campaign driving fresh attention deserves scrutiny of its own, since promises like that carry risks separate from price action. Sector-wide swings can override token-specific setups entirely, so BTW's chart should always get read alongside the widercrypto market news coverage rather than in isolation.
Glossary
RSI:A 0-100 momentum indicator. Above 70 typically signals overbought; below 30 signals oversold.
Gini Score:A measure of distribution inequality, from 0 to 1, where 1 means one wallet holds everything.
FDV:What the market cap would be if every token that will ever exist were already circulating.
Liquidation: The forced closing of a leveraged position when losses exceed the trader's margin.
Circulating Supply:The number of tokens actually available to trade right now, separate from locked or vested tokens.
Invalidation Level: The price point at which a trading thesis is considered wrong and should be abandoned.
Disclaimer: This article is for informational purposes only and does not constitute financial advice. Cryptocurrency markets are highly volatile. Always do your own research and consult a licensed financial advisor before making investment decisions.