BLESS just gave back a large chunk of its recent rally in a single session, and heavy liquidations on both sides suggest a lot of traders got caught on the wrong side of the move. Bless is a
BLESS just gave back a large chunk of its recent rally in a single session, and heavy liquidations on both sides suggest a lot of traders got caught on the wrong side of the move.
Bless is a decentralized edge-computing network that lets devices share idle CPU and GPU capacity, and this Bless Price Prediction looks at whether the price stabilizes here or extends lower over the next few days.
Here's what the chart and liquidation data show.
Bless Price Prediction Today: Market Overview
Metric
Value
Price
$0.010620
24h Change
-45%
Market Cap
$20.61M
Unlocked Market Cap
$26.12M
Fully Diluted Valuation (FDV)
$106.19M
24h Volume
$23.67M
Vol/Mkt Cap (24h)
116.3%
Liquidity/Mkt Cap
1.17%
Total Supply
9.99B BLESS
Max Supply
10B $BLESS
Circulating Supply
1.94B $BLESS
Holders
12.31K
Source: Data from CoinMarketCap as of 4/08/2026. Figures may vary slightly across other tracking websites.
Bless Liquidations and Exchange Volume
BLESS saw a wave of liquidations as the reversal played out: $6.88K over 1h (mostly longs at $4.93K), $189.98K over 4h (longs $68.83K, shorts $121.14K), $1.19M over 12h (longs $681.22K, shorts $512.92K), and $3.05M over 24h (longs $1.94M, shorts $1.10M). 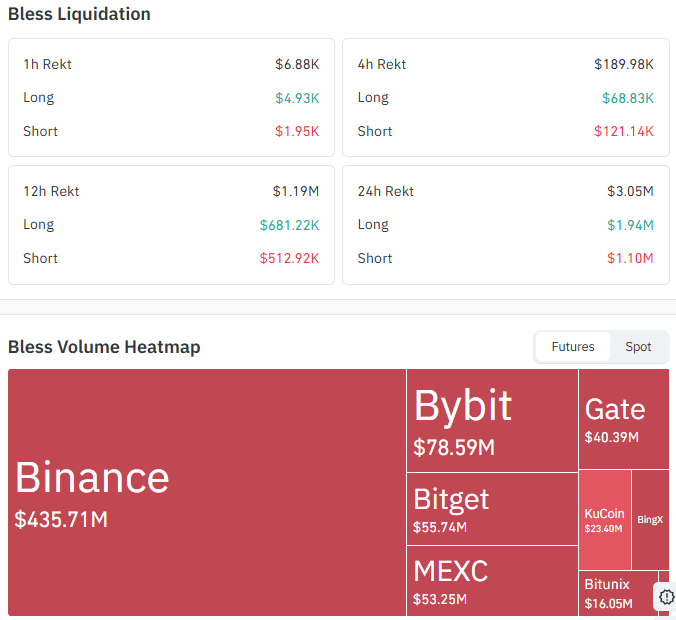
Source: Data From CoinGlass
The mix of long and short liquidations across these windows suggests both sides got caught out during the swing, first as shorts were squeezed during the pump and then as longs were flushed during the sharp pullback.
On the exchange side, Binance dominates futures volume at $435.71M, followed by Bybit at $78.59M, Bitget at $55.74M, MEXC at $53.25M, Gate at $40.39M, KuCoin at $23.40M, and Bitunix at $16.05M.
BLESS Price Prediction Chart: Technical Analysis
Timeframe: 1H · Source: TradingView · Timestamp: August 4, 2026, 16:54 UTC+5:30
$BLESS is trading at $0.010620 after a sharp reversal from a high near $0.022000 reached in the past few days.
Price broke down through an ascending trendline that had supported the earlier rally, sliding quickly through several levels before finding a floor and stabilizing in a range just above $0.0100761.
RSI (14), the Relative Strength Index, where readings above 70 signal overbought and below 30 oversold, sits at 31.92, firmly bearish and approaching oversold territory, consistent with the scale of the recent decline.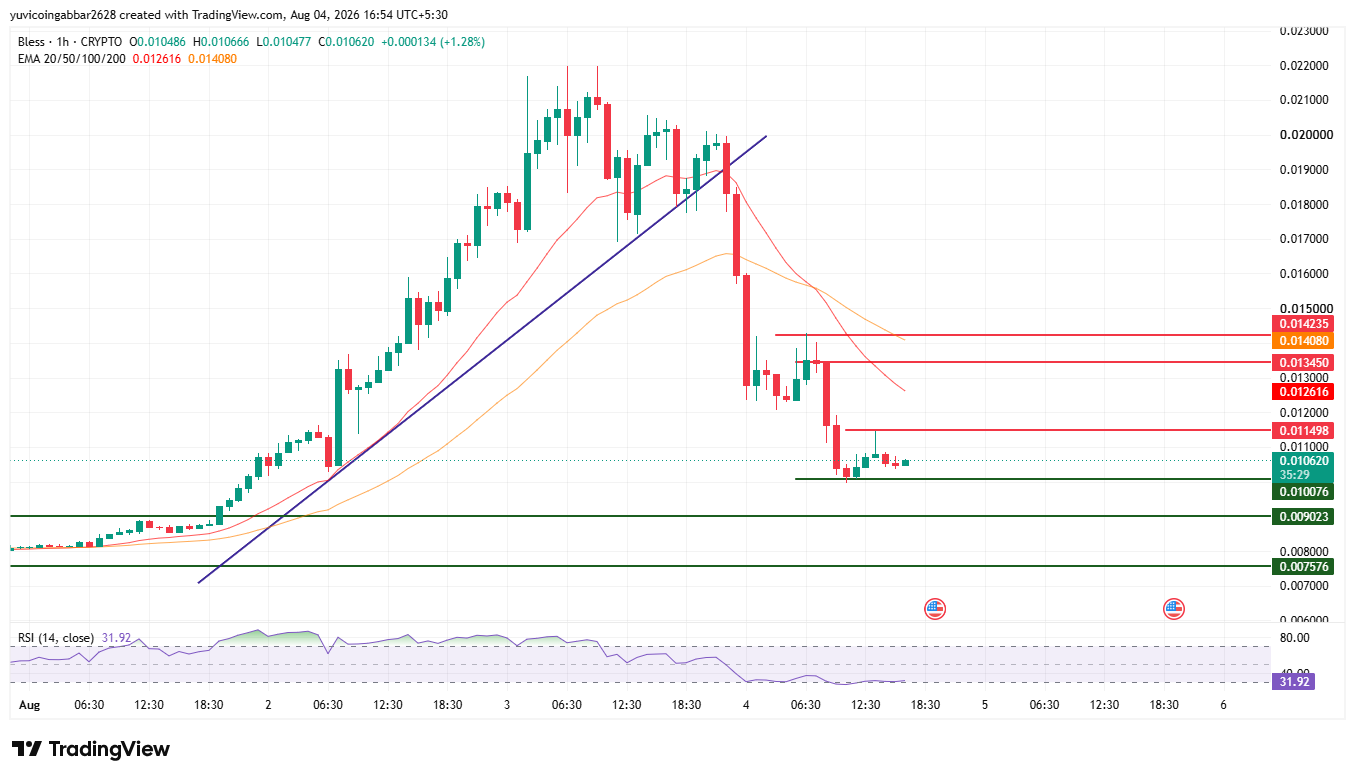
$BLESS token forecast: Support and Resistance Levels
Level Type
Price
Resistance 3
$0.014235
Resistance 2
$0.013450
Resistance 1 (nearest)
$0.011498
Immediate Price Reference
$0.010620
First Support
$0.010076
Deeper Support
$0.009023
Structural Floor
$0.007576
$BLESS token forecast: EMA Levels
EMA
Price
EMA (20)
$0.012616
EMA (50)
$0.014080
Bless Forecast: Bull Case vs. Bear Case
$BLESS price target 2026 Bull case: Holding above the first support at $0.010076 and clearing the nearest resistance at $0.011498 with a bullish EMA crossover would suggest the sharp pullback is stabilizing.
A confirmed move above $0.013450 would put the broader downtrend in question and open the path toward $0.014235.
$BLESS price target 2026 Bear case: A break below $0.010076 would suggest the current stabilization is temporary and the reversal has further to run.
Losing the deeper support at $0.009023 would expose $0.007576 as the next structural floor.
$BLESS price target: Can $BLESS reach $0.014235?
$0.014235 is the highest resistance level marked on the chart. Reaching it would require $BLESS to first hold above $0.010076, clear the nearest resistance at $0.011498, and then break through $0.013450 and the EMA cluster near $0.012616 to $0.014080, a multi-stage move rather than a single leg.
What Could Invalidate the Bullish Setup?
A rejection at $0.011498 followed by a failure to hold $0.010076 would put the current stabilization in doubt.
A deeper break below $0.009023 would undermine any recovery attempt entirely, opening a path toward the $0.007576 structural floor.
Bless Price Prediction 2026: Expert View
According to CoinGabbar analysts, The chart shows a token that moved very fast in both directions within a short window, and the heavy liquidations on both sides confirm that leverage played a large role in the swing.
There's no confirmed catalyst behind today's reversal at the time of writing, and price action of this speed in a low-liquidity token like $BLESS can happen without a specific news trigger.
RSI approaching oversold territory suggests the immediate selling pressure may be stretched, but with liquidity this thin, the $0.010076 support deserves close attention since a break there could move price quickly in either direction.
Bless Price Prediction: Data Sources
Price, EMA, and RSI data referenced from a 1H $BLESS/USD chart via TradingView, timestamped August 4, 2026, 16:54 UTC+5:30.
Market cap, FDV, volume, and supply data referenced from CoinMarketCap. Liquidation and exchange volume data referenced from Coinglass.
Disclaimer: This piece is for informational purposes only and isn't financial advice. The levels and scenarios above are based on technical chart analysis and publicly available data at the time of writing, and crypto markets can move sharply within hours, so past patterns don't guarantee future outcomes. It's worth doing independent research and considering your own risk tolerance before acting on any of the levels discussed here.