BlockchainFX Price Steadies at $0.000306 After a Four-Day Slide BlockchainFX price edged down 1.99% to $0.000306 on November 4, 2026, the smallest daily loss in four readings. After three sha
BlockchainFX Price Steadies at $0.000306 After a Four-Day Slide
BlockchainFX price edged down 1.99% to $0.000306 on November 4, 2026, the smallest daily loss in four readings.
After three sharp declines, the selling pace has slowed, and that shift is the angle for this outlook. It compares four sessions, maps the chart, and sets forecast ranges through December 2026.
Four Sessions Compared: Volume Fades as the Slide Slows
Readings from four consecutive days show BFX falling from $0.000456 to $0.000306, a cumulative drop of 32.9%.
Volume peaked on the second day and has since fallen 43.5%, while pool TVL has stayed in a narrow $7.4K to $8.1K band.
Reading
Level
24-hour change
Volume
Pool TVL
Volume to TVL
Nov 1
$0.000456
-4.82%
$4.5K
$7.8K
0.6x
Nov 2
$0.000386
-11.98%
$13.1K
$8.1K
1.6x
Nov 3
$0.000298
-8.42%
$9.9K
$7.4K
1.3x
Nov 4
$0.000306
-1.99%
$7.4K
$7.6K
1.0x
Turnover against pool depth has dropped from 1.6 times to 1.0 times, which can indicate cooling pressure rather than fresh panic.
BlockchainFX Price still sits about 99.99% below its 52-week high of $6.40.
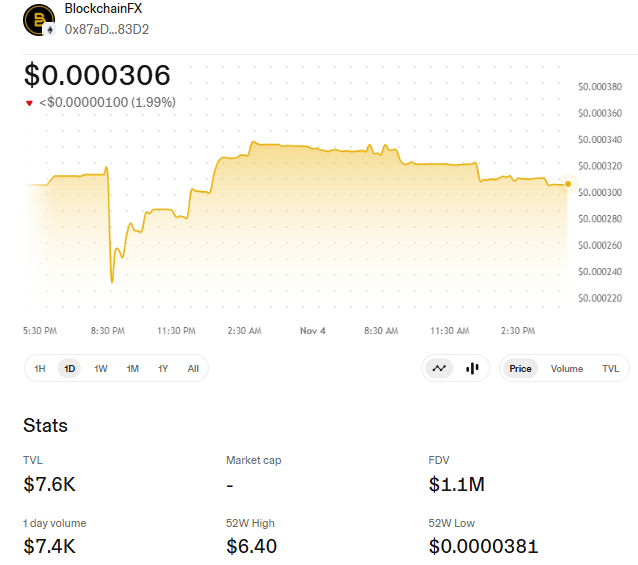
Source: Uniswap Trading Chart
Note: Prices can change quickly, so figures may not reflect the latest value. Readers should check a live price tracker for current data.
The $0.000232 Dip and the 32% Rebound That Followed
The 24-hour chart shows a sharp flush in the evening, then a recovery to a high near $0.000338 by early morning.
Since then BFX has drifted lower in small steps, and a swing this wide in a pool of $7.6K shows how one large order can move the market.
24-hour low: near $0.000232
24-hour high: near $0.000338
Range width: $0.000106, or 35% of today’s level
Rebound from the low: 32%
Pool Depth: $7.6K Liquidity Against a $1.1M FDV
Fully diluted value (FDV) of $1.1M compares with pool TVL of $7.6K, a ratio of roughly 0.7%.
No market cap is listed, so FDV remains the best size gauge. At this depth, BlockchainFX Price can move more than 20% inside a day, as the chart showed.
Support and Resistance Map From the 24-Hour Chart
The chart gives two support zones and three resistance zones. The $0.000285 shelf held during the overnight recovery, while $0.000338 capped the rebound.
Marker
Value
Move from $0.000306
Implied FDV
Support 2
$0.000232
-24.2%
$0.81M
Support 1
$0.000285
-6.9%
$1.00M
Resistance 1
$0.000320
+4.6%
$1.12M
Resistance 2
$0.000338
+10.5%
$1.18M
Resistance 3
$0.000400
+30.7%
$1.40M
A close above $0.000320 would be the first sign that BlockchainFX Price is holding the recovery, while a drop under $0.000285 would put the dip low back in play.
Forecast Ranges for Mid-November, Month-End, and Year-End 2026
These ranges combine the cooling-pressure reading with the thin pool, so they widen sharply over time. They are estimates, not guaranteed outcomes, and the BlockchainFX price path can break them quickly if one large wallet acts.
Horizon
Bear
Base
Bull
Nov 11, 2026
$0.000230 to $0.000270
$0.000280 to $0.000335
$0.000350 to $0.000420
Nov 30, 2026
$0.000190 to $0.000250
$0.000260 to $0.000350
$0.000370 to $0.000480
Dec 31, 2026
$0.000120 to $0.000210
$0.000230 to $0.000390
$0.000430 to $0.000650
Distance from today’s reading at the first horizon:
The base path expects BFX to stay between $0.000280 and $0.000335 into mid-November as selling pressure keeps fading.
By Dec 31, the bear floor of $0.000120 is about 61% below today’s level, and the bull cap of $0.000650 is about 112% above.
What Would Confirm a Recovery or Reopen the Slide
Four items can shift the outlook quickly:
A daily close above $0.000320 with volume rising above $7.4K
A break below $0.000285 on higher volume
Pool TVL moving above the $8.1K seen on the second day
The Nov 10 token burn, where the project has said 500,000,000 unsold presale tokens will be removed and the new total supply will matter for FDV
Overall, BlockchainFX Price looks stabilized rather than recovered: the pace of loss has slowed, but depth is thin, and no level has been reclaimed yet.
Anyone following the crypto market should rely on on-chain data and official updates rather than a single reading.
YMYL Disclaimer: This article is for informational and educational purposes only and should not be taken as financial or investment advice. Crypto markets are volatile, and details such as prices, burn plans, or supply figures mentioned here can change over time. Readers should do their own research before making any decisions based on this content.