A 25.85% Daily Drop Resets the Chart on Nov 9 A token chart reading on Nov 9, 2026 shows BFX at $0.000201, down 25.85% over 24 hours. The line held a flat band through most of the previous af
A 25.85% Daily Drop Resets the Chart on Nov 9
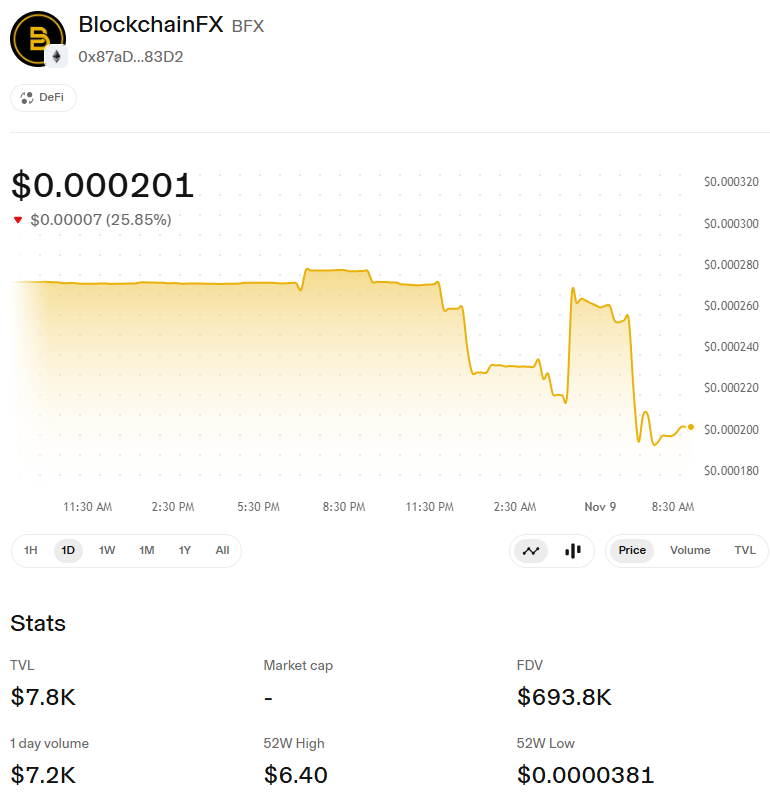
A token chart reading on Nov 9, 2026 shows BFX at $0.000201, down 25.85% over 24 hours.
The line held a flat band through most of the previous afternoon and evening, slipped in steps overnight, then bounced sharply in the early hours before giving most of it back by morning.
With TVL at $7.8K and FDV at $693.8K, the BlockchainFX price is now searching for its next floor.
Metric
Reading
Last reading
$0.000201
24-hour change
-25.85%
TVL
$7.8K
FDV
$693.8K
1-day volume
$7.2K
52-week range
$0.0000381 to $6.40
Source: Uniswap Chart
Note: Prices can change quickly, so figures may not reflect the latest value. Readers should check a live price tracker for current data.
BlockchainFX Price Recovery Math After a 25.85% Slide
A 25.85% loss needs a gain of about 34.9% to return to the starting point, because the gain applies to a smaller base.
That is why the BlockchainFX price can look close to a bounce target while still sitting far from it.
Another slide of the same size would land near $0.000149, close to the lower edge of the bear range below. The table maps nearby targets from the current reading.
Target
Gain needed
Chart reference
$0.000230
+14.4%
Overnight shelf
$0.000255
+26.9%
Morning range before the drop
$0.000277
+37.8%
24-hour high
Volume of $7.2K Against a $7.8K Pool Shows Heavy Turnover
Turnover: daily volume equals about 92% of TVL, which is high relative to pool size.
Depth: TVL is only about 1.1% of FDV, so a few wallets can dominate a session.
Direction: heavy turnover on a falling line points to sellers, though the pool is too small to confirm broad participation.
Moves on this turnover carry less weight than the same move on a deeper market, so a BlockchainFX price rebound needs follow-through before it counts.
Forecast Table: Seven-Day and 30-Day Price Ranges
The BlockchainFX price forecast below starts from today’s reading. These are estimates, not guaranteed outcomes.
Scenario
Next 7 days
Move vs reading
Next 30 days
Move vs reading
Bear
$0.000150 to $0.000185
-25.4% to -8.0%
$0.000100 to $0.000150
-50.2% to -25.4%
Base
$0.000185 to $0.000240
-8.0% to +19.4%
$0.000150 to $0.000250
-25.4% to +24.4%
Bull
$0.000250 to $0.000320
+24.4% to +59.2%
$0.000300 to $0.000380
+49.3% to +89.1%
The base case allows for a choppy sideways stretch, since the line has just absorbed a large drop.
Ranges widen over 30 days because a pool this small can change direction on a handful of trades. The bull case needs steady buying that holds through several sessions. The bear case appears if sellers return before the line stabilizes.
Levels to Watch: $0.000193 Low and $0.000277 High
Support: the morning low near $0.000193. A close below it opens the $0.000150 to $0.000185 range.
First resistance: the overnight shelf near $0.000230. A hold above it would suggest the BlockchainFX price is stabilizing.
Second resistance: the $0.000255 area, where the line traded before the latest leg down.
Volume check: a rebound on volume near or above $7.2K would carry more weight than a quiet drift.
Spike caution: the early bounce reversed within hours, so one sharp candle is a weak signal.
Reading the 52-Week Range: $0.0000381 to $6.40
The tracker lists a 52-week low of $0.0000381 and a high of $6.40. A range this wide works better as background than as a target, since the high has little link to today’s pool depth.
The tracker shows market cap as unavailable, so FDV is the only valuation figure here, and it counts the full token supply rather than what is actively trading.
Risk Notes and Where the Outlook Leans This Week
A 25.85% daily loss on $7.2K of trading leaves the BlockchainFX price exposed in both directions.
The outlook leans cautious, with a sideways-to-lower bias until the line holds above the overnight shelf on steady buying.
Two checks decide the week: whether the morning low survives another test and whether any rebound arrives with volume close to pool size. Any project update that could change that picture would appear first on the official project channels.
YMYL Disclaimer: This article is for informational and educational purposes only and should not be taken as financial or investment advice. Crypto markets are volatile, and details such as roles, plans, or figures mentioned here can change over time. Readers should do their own research before making any decisions based on this content.