$BNB is holding strong just under a key level, and traders are watching to see if it breaks through. This BNB price prediction looks at whether $BNB can push higher from here or cool off firs
$BNB is holding strong just under a key level, and traders are watching to see if it breaks through.
This BNB price prediction looks at whether $BNB can push higher from here or cool off first, with the bullish case staying alive above $677 & $636 over the next few sessions, while a break below that level opens the door to a deeper pullback.
Here's what the numbers show right now.
Market data was checked on August 31, 2026, at 11:50 IST.
BNB Price Prediction Today: Market Overview
Metric
Value
Price
$687.28
24h Change
-1%
Market Cap
$91.44B (-1.01%)
FDV
$91.44B
24h Volume
$1.27B (up 33.8%)
Vol/Mkt Cap (24h)
1.39%
Total Supply
133.16M $BNB
Max Supply
133.16M $BNB
Circulating Supply
133.16M $BNB
Treasury Holdings
686.07K $BNB
Source: Data from CoinMarketCap as of August 31, 2026, at 11:50 IST. Figures may vary slightly across other tracking websites.
BNB Price Prediction Chart: Technical Analysis
Pair: BNB/USD · Market: Spot (Crypto) · Timeframe: 1D · Source: TradingView · Timestamp: August 31, 2026, 11:50 UTC+5:30
BNB is trading at $687.28, consolidating inside a highlighted zone just below the $718.63 resistance after a strong run higher through August.
Both EMAs sit well below current price, at $665.50 and $631.16, showing the broader trend is still pointed up even as this consolidation plays out.
Price is trading at an important level, and a breakout in either direction will likely define the next trend.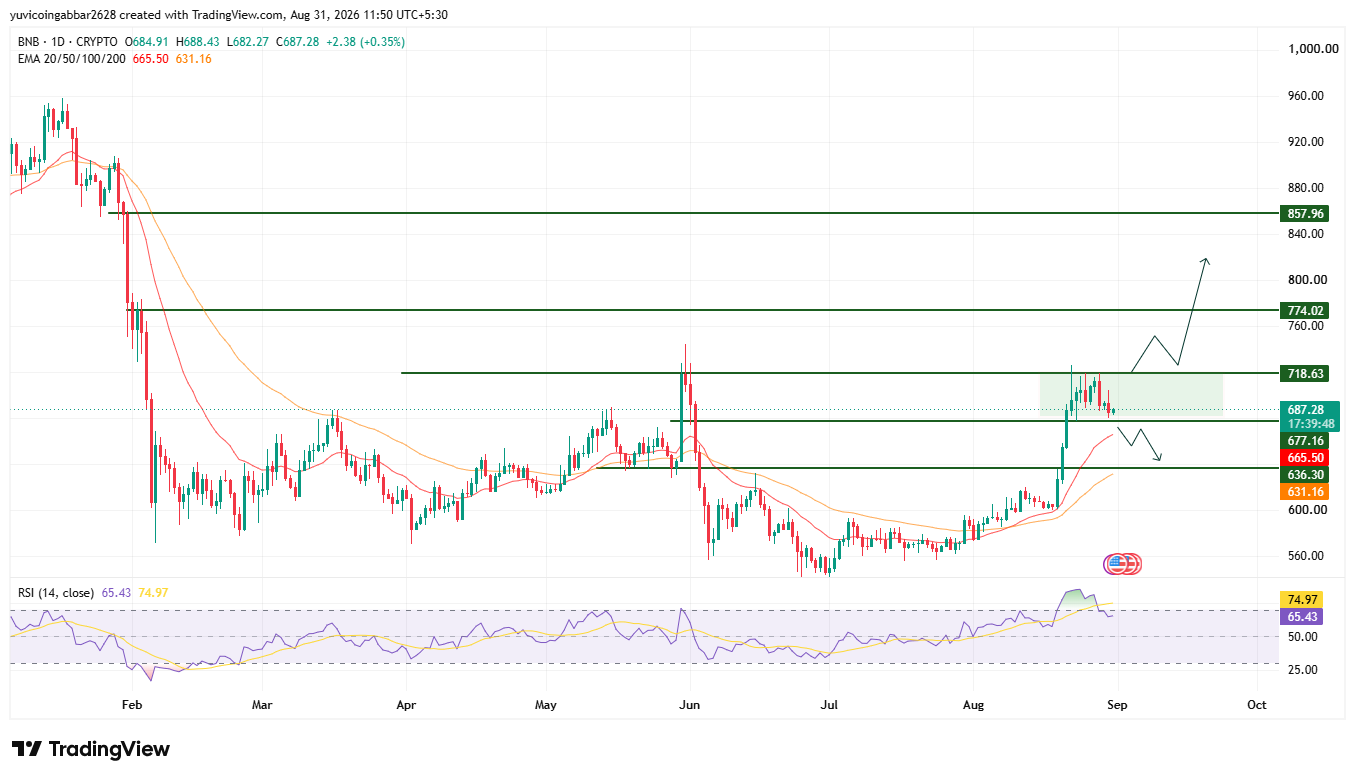
BNB Price Prediction: Key Levels
Level Type
Price
Resistance 3
$857.96
Resistance 2
$774.02
Resistance 1 (nearest)
$718.63
Immediate Price Reference
$687.28
First Confirmed Support
$677.16
Deeper Support
$636.30
$BNB Forecast: Bull Case vs Bear Case
Bull case: A daily close above the nearest resistance at $718.63 would confirm the consolidation is resolving upward, opening a path toward $774.02 and eventually $857.96 if buying pressure holds.
Bear case: Losing the first confirmed support at $677.16 would put the current consolidation at risk, exposing the deeper support at $636.30 as the next downside level.
$BNB Price Scenarios: Triggers and Invalidation
Scenario
Trigger
Likely Outcome
Invalidation Point
Breakout continuation (bullish)
Daily close above $718.63
Move toward $774.02, then $857.96
Close back below $687.28
Range hold
Price holds above $677.16
Consolidation before next push
Break below $677.16
Range breakdown (bearish)
Daily close below $677.16
Drop toward $636.30
Reclaim above $677.16
Can BNB Reach $1,000?
The highest resistance marked on the chart sits at $857.96.
Reaching $1,000 would require clearing this level in stages. The first hurdle is $718.63, followed by $774.02.
Only after $BNB clears both of these levels would $857.96 come into range, and clearing that would open the path toward the $1,000 mark.
This remains a long-term view rather than a near-term target.
$BNB Price Prediction: Expert View
According to CoinGabbar analysts, BNB's consolidation right below $718.63 looks orderly, with both EMAs still trending well beneath price, a sign the broader uptrend hasn't broken down.
The $677.16 to $718.63 zone is the one to watch: holding it keeps the path toward higher resistance levels open.
Disclaimer
This piece is for informational purposes only and isn't financial advice. The levels and scenarios above are based on technical chart analysis and publicly available data at the time of writing, and crypto markets can move sharply within hours, so past patterns don't guarantee future outcomes. It's worth doing independent research and considering your own risk tolerance before acting on any of the levels discussed here.