This Bonk price prediction 2026 looks at $BONK trading around $0.00000429, right after BonkDAO confirmed a $20 million governance attack drained its treasury. That's not a small footnote; it'
This Bonk price prediction 2026 looks at $BONK trading around $0.00000429, right after BonkDAO confirmed a $20 million governance attack drained its treasury.
That's not a small footnote; it's the backdrop everything else in this chart needs to be read against.
$BONK has spent most of the past year grinding lower inside a descending channel, and price only recently pushed up toward the top of that structure before this week's news knocked it back down.
So the question isn't just "What does the chart say?" It's whether the chart even matters as much as usual right now.
What Traders Are Actually Reacting To
A post from trader @TheMoonHailey, shared via the CoinEx creator program, put it about as bluntly as anyone has:
$BONK is facing a $20 million treasury drain after an attacker spent roughly $4 million to push a malicious proposal through, and the chart is still holding for now. Her read was simple 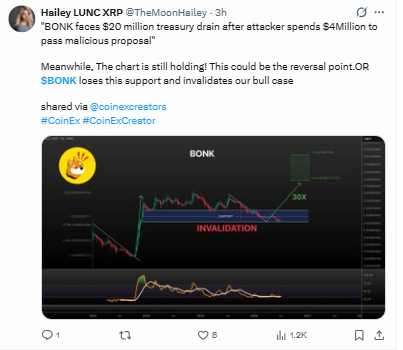
Source:Data Taken By X
Either this turns into the reversal point, or $BONK loses the support underneath it and the whole bull case gets invalidated.
That framing is worth sitting with, because it's not really a technical call.
It's a bet on whether the community trusts BonkDAO enough to keep holding through a security scare, and that's a much harder thing to chart than a support line.
BONK Liquidation Data: Longs Are Absorbing the Damage 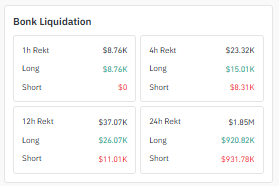
Source:Data Taken By Coinglass
Here's how liquidations have broken down across the last four windows:
TimeframeTotal RektLongs LiquidatedShorts Liquidated1 Hour$8.76K$8.76K$04 Hours$23.32K$15.01K$8.31K12 Hours$37.07K$26.03K$11.01K24 Hours$1.85M$920.82K$931.78K
The short-term windows tell a clear story: longs have been taking almost all of the pain, which fits a market getting caught leaning bullish right as bad news hits.
But stretch the window out to a full day and it evens out almost perfectly, with longs and shorts getting hit in roughly equal measure.
That's less "one-sided panic" and more "violent chop in both directions," which tracks with how fast this news broke.
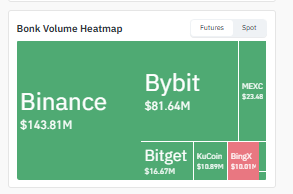
BONK Volume Heatmap: Where the Trading Is Happening
Source: Data Taken By Coinglass
Exchange24H VolumeBinance$143.81MBybit$81.64MMEXC$23.68MBingX$18.01MBitget$16.67MKuCoin$10.89M
Binance and Bybit are carrying the overwhelming majority of volume here, which is actually a reassuring detail given the circumstances.
Liquidity hasn't scattered or dried up post-attack.
It's just concentrated on the two venues that usually dominate BONK trading anyway.
BONK 4-Hour Chart Analysis: Sitting at a Decision Point
On the 4-hour, BONK is trading at $0.00000429, down slightly (-0.69%) after opening at $0.00000431 and trading in a tight band between $0.00000432 and $0.00000425. 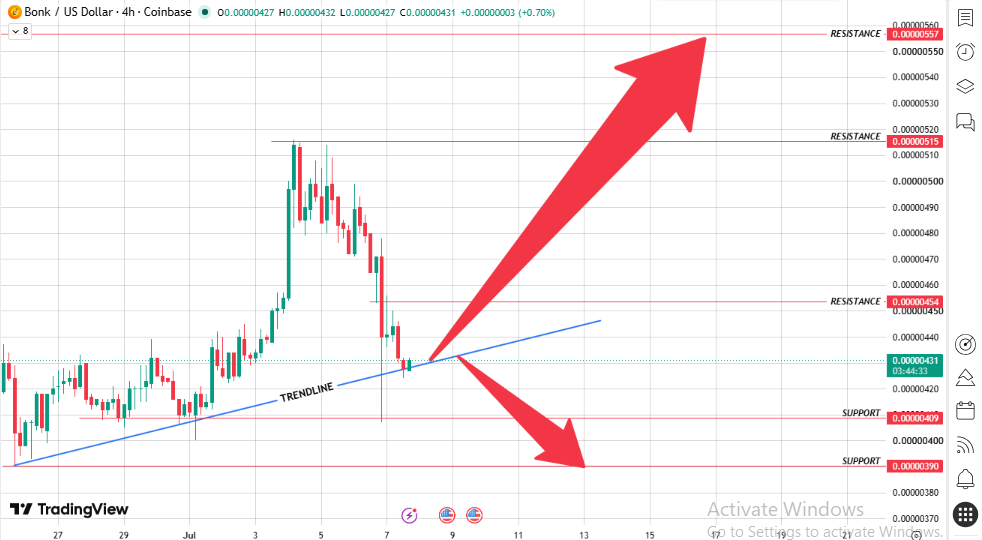
Source:Chart Taken By TradingView
What makes this interesting is where that tight range is sitting right at the exact point where a longer ascending trendline runs into a much sharper recent slide down from the highs.
It's the kind of setup that tends to resolve quickly once it moves.
BONK Key Support & Resistance LevelsLevel TypePrice (USD)Resistance 30.00000557Resistance 20.00000515Resistance 10.00000471Current Price0.00000431Support 10.00000409Support 20.00000390
A break above $0.00000471 would be the first real sign short-term buyers are stepping back in. Losing $0.00000409 instead points toward a retest of $0.00000390 fairly quickly.
BONK 1-Week Chart Analysis: Still Inside the Descending Channel
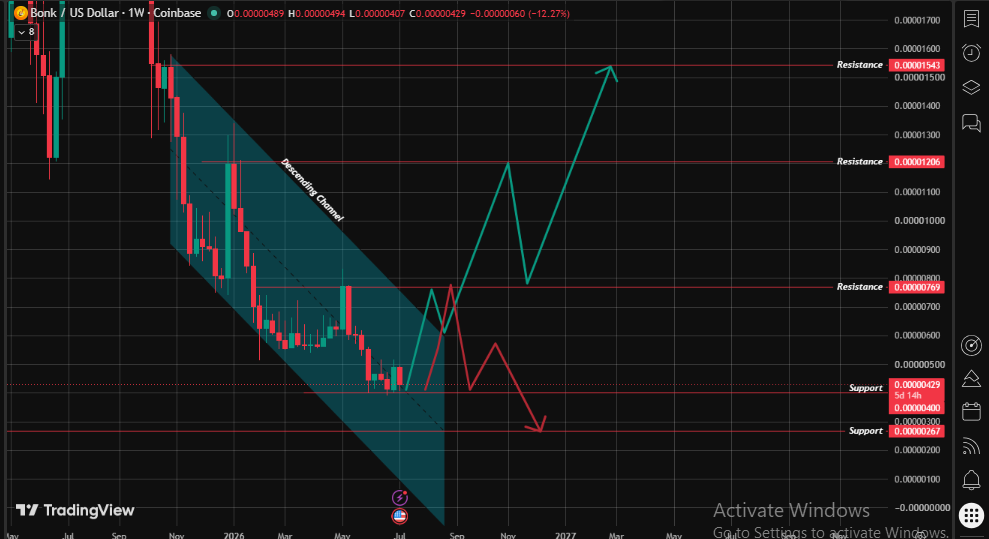
Zoom out to the weekly chart, and the picture gets more cautious. BONK has been stuck inside a well-defined descending channel for the better part of a year.
Bouncing between its upper and lower rails while carving out lower highs the whole way down.
Source:Chart Taken By TradingView
The current base for this stretch since mid-2026 is the tightest consolidation the channel has produced yet.
BONK Key Support & Resistance LevelsLevel TypePrice (USD)Resistance 30.00001543Resistance 20.00001206Resistance 10.00000769Current Price0.00000429Support 10.00000400Support 20.00000267
A weekly close above $0.00000769 would be the first real evidence the channel is breaking. Until that happens, the path of least resistance still points toward more consolidation, or a deeper retest if the treasury news keeps weighing on sentiment.
BONK Price Prediction 2026: Target TableScenarioTimeframeTarget Price (USD)Trigger ConditionBearish TargetShort-Term0.00000390Loss of 4H support at 0.00000409Bearish TargetMedium-Term0.00000267Weekly close below 0.00000400Base CaseShort-Term0.00000471Continuation of the current 4H rangeBullish TargetMedium-Term0.00001206Break above 0.00000769 weekly resistanceBullish TargetLong-Term0.00001543Confirmed breakout from the descending channelBottom Line: BONK Price Prediction Outlook Today
Put the chart and the news side by side, and BONK's near-term picture is genuinely split down the middle. On the smaller timeframe, price is coiled right at a trendline inflection point with no clear winner yet.
On the bigger picture, the descending channel is still fully intact, and a security incident of this size is exactly the kind of thing that tests whether a base like this holds or gives way.
Hold $0.00000409 through the next few sessions, and the setup for a real channel breakout stays alive.
Lose $0.00000400 on the weekly chart instead, and the deeper retest toward $0.00000267 becomes the more likely path, treasury attack or not.
Liquidation volumes have picked up compared to BONK's usual quiet stretches, and that's worth watching closely over the next few days as the market keeps digesting the news.
Disclaimer: This article is for informational purposes only and does not constitute financial, investment, or trading advice. Cryptocurrency markets, including BONK, are highly volatile and speculative, and the recent BonkDAO security incident adds further uncertainty beyond normal price risk. Chart patterns, support/resistance levels, and indicators discussed here are based on historical and technical data and do not guarantee future price movements. Always do your own research and consult a licensed financial advisor before making any investment decisions.