Bonk has spent a long stretch fading out of the conversation after its explosive 2023–2024 run, and the chart right now is starting to hint at something worth paying attention to again. This
Bonk has spent a long stretch fading out of the conversation after its explosive 2023–2024 run, and the chart right now is starting to hint at something worth paying attention to again.
This Bonk price prediction 2030 isn't built on hope; it's built on what the monthly candles are actually showing.
BONK is trading near$0.00000407, sitting just above a tight support shelf after a long, grinding slide down from a much higher base earlier in the chart. That decline has been following a clean descending trendline for a while now, and price is currently pressing right up against it, which is exactly why this Bonk price prediction 2030 is worth digging into right now.
Nothing here points to a straight line up. But there's a real structure forming, and it's worth mapping out level by level.
Why $BONK Is Worth Watching Again
$BONK spent the back half of its recent decline losing ground in a fairly orderly way, each lower high capped by the same descending trendline running down from the earlier highs on this chart.
That's the kind of setup that tends to get attention once price finally starts compressing near the line instead of just sliding straight through it.
Either $BONK finds support here and starts building a real base, or it breaks down again and continues the slide that's defined most of this chart.
A Quick Look Back at BONK's Chart
Earlier in the chart, BONK put in a series of strong green candles during its initial push, followed by a long, heavy stretch of red candles grinding the price down toward current levels, a shape that's fairly typical for a meme coin working through the back half of a boom-and-bust cycle.
What matters now is that the decline has slowed.
Price is no longer accelerating lower; it's compressing into a tighter range just above support, right against the descending trendline that's capped every recent bounce attempt.
Is There Anything Behind BONK, Or Is This Just a Chart Pattern?
BONK carries a few things a lot of pure meme coins don't: an active ecosystem across BonkSwap, BonkDEX, and related Solana-based tools, a history of community-driven burn events that have measurably reduced supply, and deep integration across hundreds of Solana dApps.
That gives it a slightly different demand floor than a token with nothing but a mascot behind it. Whether that ecosystem is enough to drive a serious long-term recovery is a separate question.
But it's part of why BONK has stayed relevant longer than many tokens that launched around the same time.
Monthly Chart Analysis for 50x Bonk price prediction 2030
The standout feature on this chart is the descending trendline running from the earlier highs down through the recent price action, capping every bounce along the way.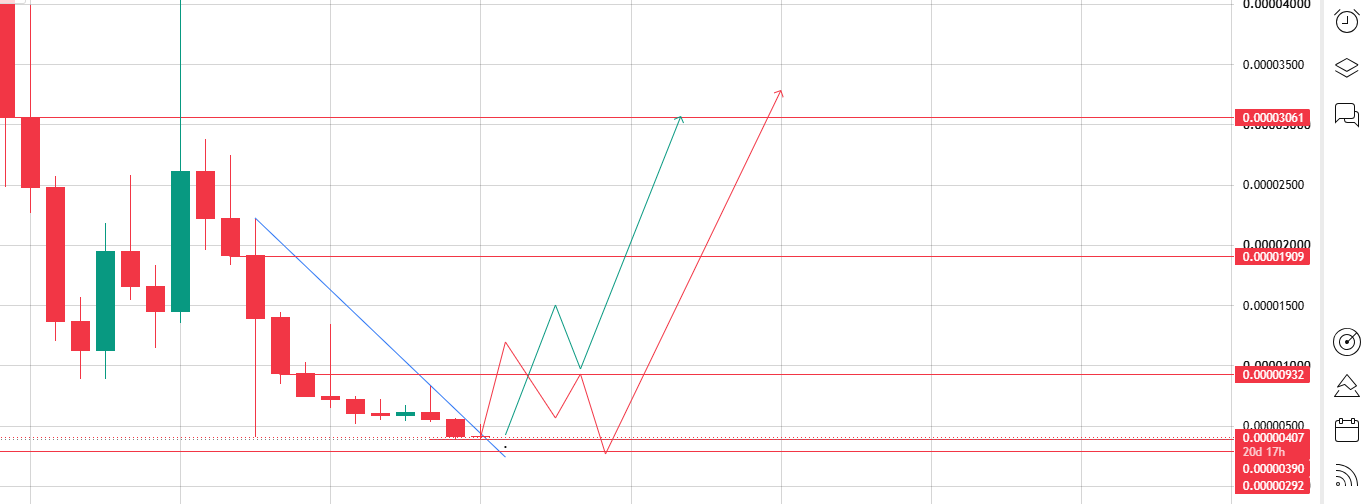
Source:Chart Taken From TradingView
BONK is currently trading at $0.00000407; here's how the levels stack up.
Resistance above:
$0.00000932, the first real ceiling and the level that would need to break to suggest the slide is genuinely over
$0.00001909, the next level up, roughly 4.7x current price
$0.00003061, the level that would confirm a genuine trend reversal rather than just a bounce off support
Support below:
$0.00000390, the shelf's current defending price
$0.00000292, the deeper floor, and where the broader structure would need to hold if this pullback extends further
Long-Term Outlook Through 2030
Zooming out, $BONK's path to 2030 depends heavily on whether the descending trendline actually gets cleared, whether Solana's ecosystem keeps growing (which tends to drag BONK along with it), and whether ongoing burn campaigns meaningfully chip into the token's roughly 88.87 trillion max supply over time.
That combination chart structure, network-level tailwinds, and active deflationary mechanics are a slightly more layered setup than most meme coins get to lean on.
Bonk Price Prediction 2030 ScenariosScenario2030 TargetCatalyst NeededBearish$0.0000015Trendline break fails to reverse, support gives way, and liquidity keeps rotating to newer Solana meme tokens.Base$0.00001909Steady multi-cycle climb with the trendline eventually clearing and holding as support.Bullish$0.00003061A strong Solana ecosystem cycle combines with aggressive burn activity and renewed meme-coin mania.
Reaching the higher end of this range isn't about one pump; it's years of the ecosystem staying active and supply continuing to shrink through burns.
Bonk Year-by-Year Target Table (2026–2030)
Year
Bear Case
Base Case
Bull Case
2026
$0.00000292
$0.00000407
$0.00000932
2027
$0.0000025
$0.0000065
$0.0000115
2028
$0.0000020
$0.0000098
$0.0000155
2029
$0.0000018
$0.0000145
$0.0000225
2030
$0.0000015
$0.00001909
$0.00003061
Three Scenarios Worth Watching
Worst case: The descending trendline holds as resistance, support at $0.00000390 eventually breaks, and $BONK slides toward $0.00000292 and beyond as attention rotates to newer Solana-based meme coins.
Base case: $BONK grinds along the trendline, slowly clears resistance across multiple cycles, and works its way toward $0.00001909 by 2030 without one dramatic breakout move.
Best case:The Solana ecosystem enters a strong multi-year cycle, burn campaigns accelerate, and $BONK pushes decisively through all three resistance levels toward $0.00003061 and beyond.
Key Levels to Watch
Resistance zone: $0.00000932 to $0.00003061, the three ceilings standing between here and a genuine trend reversal.
Support zone: $0.00000292 to $0.00000390, the base that's currently holding the structure together.
Invalidation: a clean monthly close below $0.00000292 would undercut the current base entirely and put any recovery scenario on hold for the foreseeable future.
Final Thoughts on BONK Through 2030
This setup looks more interesting than a lot of $BONK's recent chart history, mainly because price has stopped accelerating lower and is now compressing tightly against a trendline that's held for a while.
That's not a guarantee of anything, but it's a more defined technical base than BONK has had in some time. Volume needs to show up on any real push toward $0.00000932 for this to turn into more than a temporary bounce.
Outside the chart, BONK's long-term story will keep leaning on Solana's broader ecosystem growth and whether ongoing burn mechanics can meaningfully offset its enormous token supply.
Five years is a long runway, and where BONK lands by 2030 will likely come down to that combination holding up just as much as anything visible on the chart today.
Disclaimer: This article is for educational purposes only and does not constitute financial advice. Crypto markets are highly volatile. Consult your investment advisor before making any investment decision.