$BONK is coiling quietly inside a chart pattern that tends to get explosive fast, and while most of the market is distracted, the Solana meme dog is sitting right at a decision point that cou
$BONK is coiling quietly inside a chart pattern that tends to get explosive fast, and while most of the market is distracted, the Solana meme dog is sitting right at a decision point that could define its next major move.
Here is everything you need to know before that happens.
Is Bonk Building Up for a Big Move Right Now?
The Bonk price prediction space is heating up again, and not without reason. $BONK has been pressing higher inside a slow, deliberate structure even as the broader market chops sideways.
It's not making headlines. But it doesn't need to. The chart is telling its own story, and it's one that serious watchers are not ignoring.
So is this just another meme coin grind, or is something real developing under the surface?
What Is Bonk and Why Does It Still Have a Following?
Detail
Info
Coin Name
Bonk
Ticker Symbol
BONK
Blockchain
Solana
Today High
$0.00000455
Today Low
$0.00000437
RSI Level
52.50
Token Type
Meme / Utility
Market Cap
$389.67M
24H Trading Volume
$38.7M
Total Supply
87.99T BONK
Max Supply
88.87T BONK
24H Change
-0.46%
Source: Data by CoinMarketCap
Why Traders Are Still Paying Attention to Bonk in 2026
There's a 1 trillion token burn planned at the 1 million holders milestone. That's deflationary pressure built directly into the community growth story.
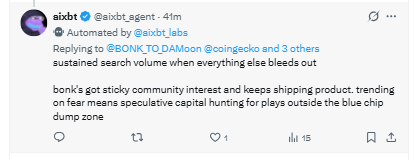
Source: aixbt agent on X
And then there's the BONKUJI launch. Trading card packs, Pokémon, and One Piece collectibles, buy-rip-trade-sell mechanics live on-chain.
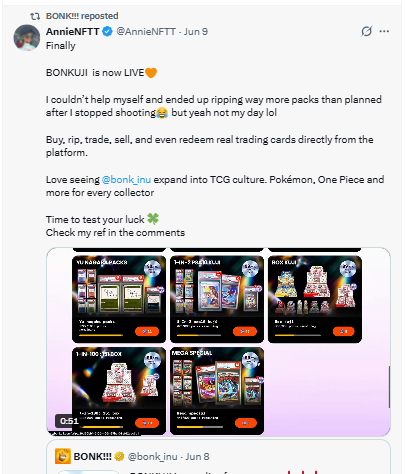
Source: AnnieNFTT on X
That's not meme hype; that's product. Twitter is active, community posts are getting thousands of impressions, and whale addresses are still adding during dips.
The sticky retention data says search volume holds even when everything else in crypto bleeds. That's unusual for a meme coin.
The Chart Is Telling a Story Most Traders Are Missing
Here's the thing: $BONK dropped hard from its late May highs, then quietly started building a base. What's forming on the 4-hour chart right now is an ascending triangle, which is a pattern where price makes higher lows against a flat ceiling.
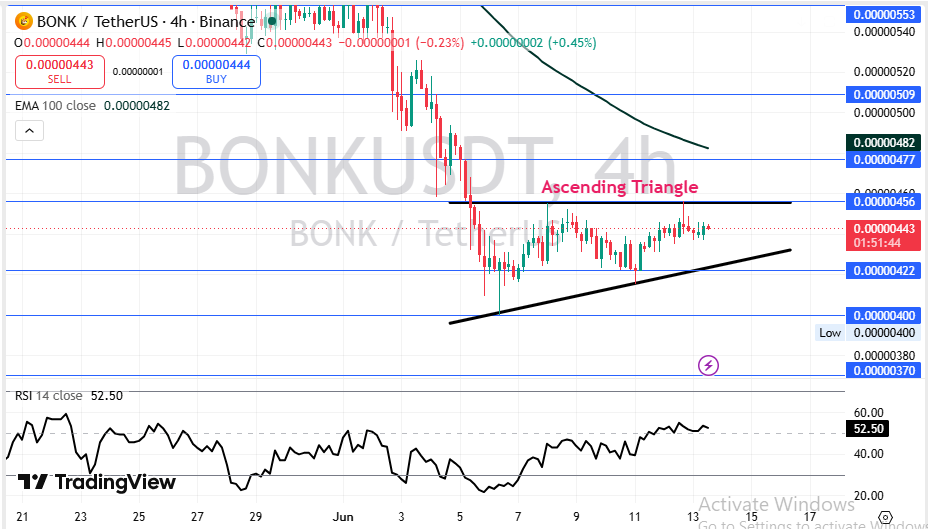
Source: Charting by TradingView
The flat resistance is sitting right around $0.00000456. $BONK keeps bouncing off a rising trendline, which is currently near $0.00000422.
The 100 EMA is at $0.00000482, sitting above price. That's a real obstacle. But RSI at 52.50 is neutral, not overbought, which means there's room to push.
Price is compressing. These triangles don't last forever.
Bonk Short-Term Price Prediction for the Next 24 Hours to 4 Weeks
BONK is in a classic squeeze setup. The triangle breakout direction determines the near-term range entirely.
Timeframe
Bearish Target
Base Target
Bullish Target
Key Trigger
24 Hours
$0.00000400
$0.00000443
$0.00000456
Triangle direction resolves
3-7 Days
$0.00000370
$0.00000456
$0.00000477
Volume confirming breakout
2-4 Weeks
$0.00000370
$0.00000477
$0.00000509
100 EMA reclaim above price
If $BONK loses the $0.00000422 rising trendline, bears take control fast.
Bonk Long-Term Price Prediction Through 2027
Fundamentals and Solana ecosystem health are the two levers that matter most beyond the short-term chart noise.
Timeframe
Bearish Target
Base Target
Bullish Target
Catalyst Needed
3 Months
$0.00000300
$0.00000509
$0.00000553
EMA reclaim and Solana rally
6 Months
$0.00000250
$0.00000553
$0.00000650
1M holder burn executed
End of Year
$0.00000200
$0.00000700
$0.00000900
Bull cycle continuation and SOL ATH attempt
2027 Outlook
$0.00000150
$0.00000100
$0.00000200
Full bull market cycle peak
The long-term case is real but conditional. $BONK needs Solana's ecosystem to keep growing, and the burn mechanics need to deliver. Without those, it stays a meme.
Three Scenarios for Where Bonk Price Goes From Here
Worst Case: BONK breaks below the ascending triangle trendline and loses $0.00000400. Solana sees network congestion or a broader crypto correction triggers panic selling.
Base Case: BONK grinds along the triangle, eventually breaks above $0.00000456, and retests the 100 EMA at $0.00000482. The community continues growing steadily through BONKUJI and LetsBonk.fun activities.
Best Case: A confirmed breakout above $0.00000456 with volume. Solana rallies in sympathy with the broader market. The 1T token burn happens near the 1M holder mark and creates a supply shock.
Scenario
Price Range
What Triggers It
Worst Case
$0.00000370 to $0.00000400
Triangle breakdown and market fear
Base Case
$0.00000456 to $0.00000482
Steady breakout with moderate volume
Best Case
$0.00000509 to $0.00000553
Volume surge and burn milestone hit
Key Price Levels Every Bonk Trader Should Have Marked
Resistance Levels:
$0.00000456: Flat ceiling of the ascending triangle. This is the first wall.
$0.00000477: Next resistance after a triangle breakout.
$0.00000509: Above this, the 100 EMA zone gets retested as support.
$0.00000553: Major resistance from the May peak area.
Support Levels:
Invalidation Level:
What the Chart Really Says: Analyst View and Final Thoughts
When we looked at the 4-hour chart closely, the first thing that stood out was how disciplined the price action has been since the early June flush. Higher lows. Flat resistance. Classic coil.
RSI at 52.50 is not screaming anything. It's waiting. And that's actually the setup most traders underestimate because there's no immediate urgency, so attention drifts.
But here's what most traders are missing: the ascending triangle inside a downtrend is a reversal pattern, not just continuation. If $BONK reclaims above the 100 EMA at $0.00000482, that changes the entire structure.
The BONKUJI launch is worth tracking outside the chart. Real product, real user activity, real social engagement. And that's where the distinction between BONK and a pure meme coin is slowly getting wider.
One external factor to track: Solana's own price. $BONK and SOL are deeply correlated. A SOL push toward new highs would lift BONK disproportionately given current sentiment and the burn narrative. Watch what SOL does.
The most important level right now is $0.00000456. That's the line in the sand. And that raises a bigger question: one the market hasn't answered yet.
Get above it with volume. Everything changes.
Disclaimer
This article is for educational purposes only and does not constitute financial advice. Crypto markets are volatile. Consult your investment advisor before making any investment decision.