BONK dropped onto Solana back in December 2022, no presale, no VC round, just a straight-up airdrop to the community. And that's honestly what made it stick around. This BONK price prediction
BONK dropped onto Solana back in December 2022, no presale, no VC round, just a straight-up airdrop to the community.
And that's honestly what made it stick around. This BONK price prediction starts from where things stand today, price at $0.000002344, down 4.8% on the day.
One thing worth noting: all 87.995T tokens are already circulating. No unlocks are waiting in the wings to hit the market later.
So whatever direction BONK takes from here, it's demand driving it, not some supply shock down the road.
$BONK Live Market Data
Price is currently trading at $0.000002344, down 4.8% on the day. Today's swing has stayed between $0.000002329 and $0.000002488, nothing too wild. 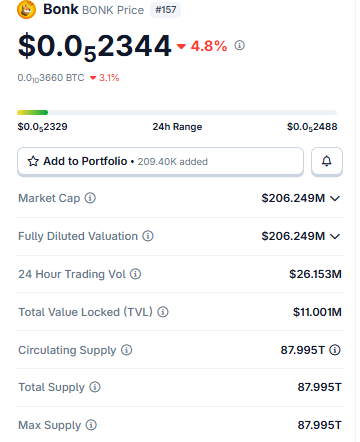
Source: $BONK market cap data taken from Coingecko, data as of Aug 11, 2026. Figures may vary slightly across other tracking websites.
Market cap comes in at $206.249M, and since every token that'll ever exist is already circulating, that number doubles as the fully diluted valuation too.
TVL across BONK protocols sits at $11.001M. Volume for the last 24 hours landed at $26.153M.
Liquidation Data of $BONK
$12.05K was wiped out over the past day, and Longs ate almost the entire bill at $10.42K. Shorts? Just $1.64K. 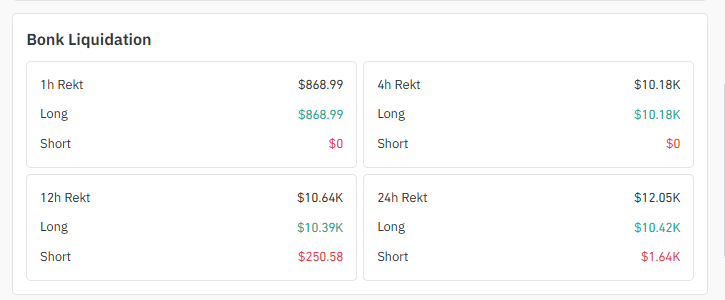
Source: liquidation data taken from Coinglass.
Zoom into the 4-hour window, and it's even more lopsided: $10.18K in long liquidations, zero on the short side. Same story an hour out too.
Traders clearly leaned bullish going into this dip, and the pullback caught a lot of them leaning the wrong way.
Exchange Volume
OKX is out front with $4.09M in volume. Bitunix follows at $1.62M, and LBank closes behind at $1.56M. 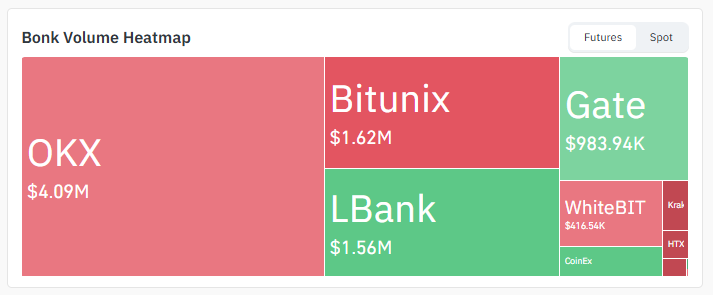
Source: Volume heatmap data taken from Coinglass.
Gate's pulling in $983.94K, and smaller amounts trickle in from WhiteBIT, CoinEx, Kraken, and HTX.
Not the deepest liquidity out there, but a decent spread for a meme coin at this size.
Key Takeaways
BONK sits at $0.0₅2344 right now, down 4.8% for the day.
4H chart? Price just bounced off the lower edge of a descending channel.
The daily timeframe shows a falling wedge forming. Worth watching closely.
Longs got hammered in liquidations, with $10.42K gone in 24 hours, while shorts barely got touched.
OKX is running the show on volume, $4.09M and counting.
Technical Analysis $BONK
4-Chart Analysis for Bonk Price Prediction
Zoom into the 4H and BONK's bouncing right off the descending channel lower boundary, around $0.00000232. 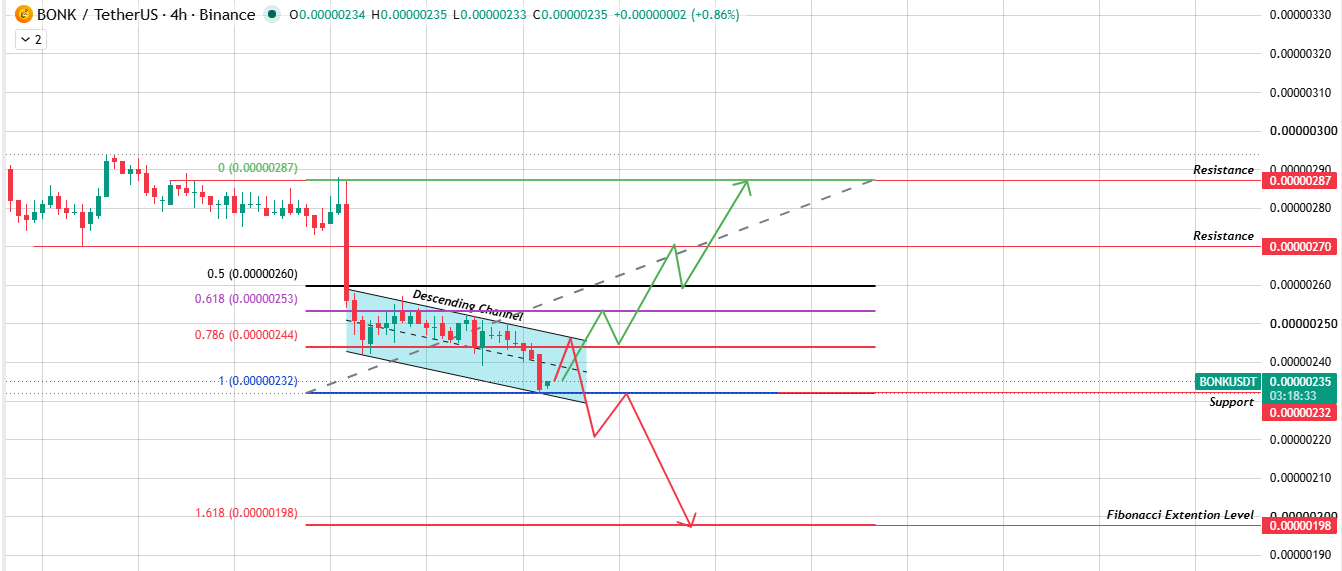
Source: Chart Taken From TradingView.
Climb back up, break the upper boundary of the channel with real volume behind it, and $0.00000270 comes into play first, then $0.00000287 after that.
If this bounce doesn't hold, then the lower boundary gives way instead? That opens the door to the 1.618 Fibonacci extension down at $0.00000198. Not a small drop.
Daily Chart Analysis for Bonk Price Prediction
Switch to the daily chart, and there's a falling wedge pattern. These usually break upward; that's the textbook behavior anyway. 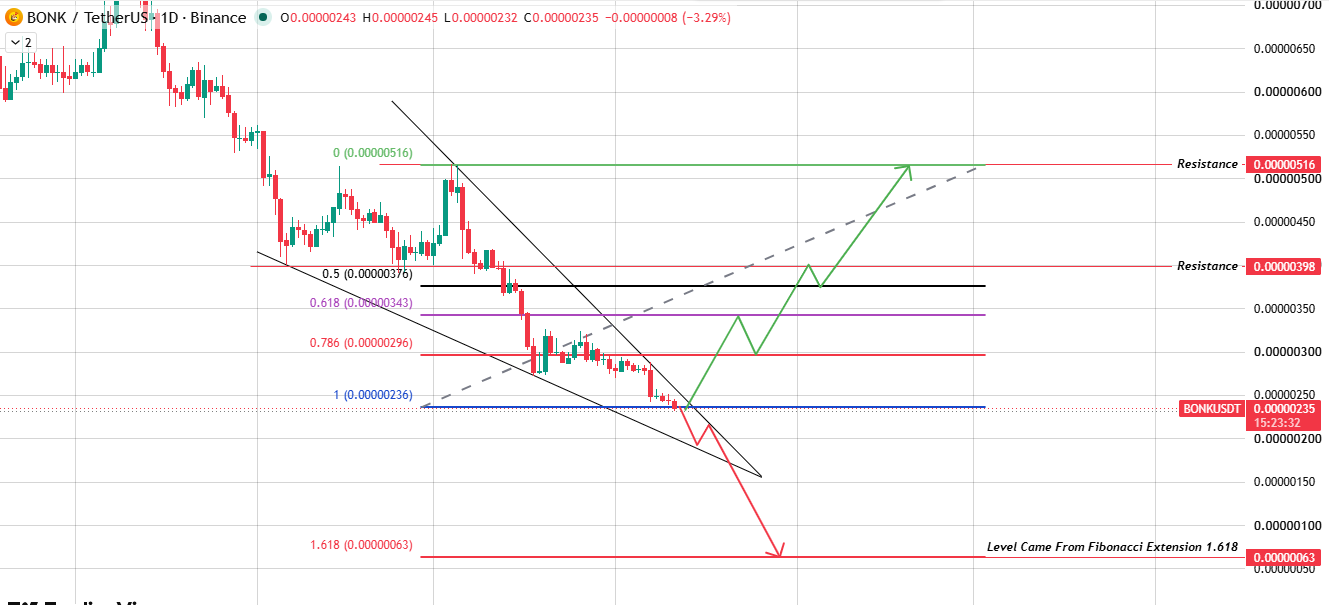
Source: Chart Taken From TradingView.
A volume-backed break above the wedge sends price toward $0.00000398, then possibly $0.00000516 if momentum keeps going.
Break the other way, though, and things get rough fast; the 1.618 extension sits way down at $0.00000063.
Two timeframes, two patterns, the same message really: BONK's at a spot where the next move counts for a lot.
Bull / Base / Bear Case
ScenarioTriggerTarget
BullBreak above $0.00000270 (4H) or $0.00000398 (1D wedge) with volume.
$0.00000287 - $0.00000516BasePrice holds between $0.00000232 and $0.00000270.
Range-bound movementBearBreak below $0.00000232 (4H) or wedge lower boundary.
$0.00000198 - $0.00000063Glossary:
Descending Channel: price keeps grinding lower here, stuck between two parallel lines both sloping down, until eventually one side breaks.
Falling Wedge: picture two trendlines converging as they both angle downward. Funny enough, this setup usually resolves upward once it plays out.
Fibonacci Extension: Traders use this to guess where price might go next, based on math applied to a previous swing move.
Liquidation: happens when your leveraged position runs out of margin and the exchange just closes it out for you, no warning.
Support Zone: basically a spot on the chart where buyers have shown up before and put the brakes on a decline.
Methodology
Every level in this BONK price prediction comes straight off TradingView, pulled from the 4H and 1D charts, Fibonacci extensions included. Liquidation and volume numbers come from Coinglass. Nothing here is guessed or extended beyond what's actually on the charts.
Disclaimer: This article is for informational purposes only and should not be treated as financial advice. Cryptocurrency markets are highly volatile, and prices can change quickly. Always do your own research and consult a financial advisor before making investment decisions.