$BONK is a dog-themed memecoin built on the Solana blockchain, known for its large community and wide circulating supply. This BONK Price Prediction looks at where BONK could head over the ne
$BONK is a dog-themed memecoin built on the Solana blockchain, known for its large community and wide circulating supply.
This BONK Price Prediction looks at where BONK could head over the next one to two weeks after a reported Upbit delisting notice weighed on sentiment, with the bearish case staying in play as long as price holds below $0.000002569, while a reclaim of that level would open the door to a recovery.
Here's what the data shows.
Market data checked on August 8, 2026, at 10:33 IST.
BONK Price Prediction Today: Market Overview
Metric
Value
Price
$0.000002460
24h Change
-11.24%
Market Cap
$217.586M
FDV
$217.586M
24h Volume
$77.66M
Total Value Locked
$10.76M
Circulating Supply
87.995T BONK
Total Supply
87.995T $BONK
Max Supply
87.995T $BONK
Source: Data from CoinGecko as of 08/08/2026 at 10:33 IST. Figures may vary slightly across other tracking websites.
BONK Price Prediction: Upbit Delisting Report
According to a report from Wu Blockchain, a crypto news outlet, Upbit, South Korea's largest crypto exchange, plans to delist BONK on September 7, 2026, affecting both the BONK/KRW and BONK/USDT trading pairs. 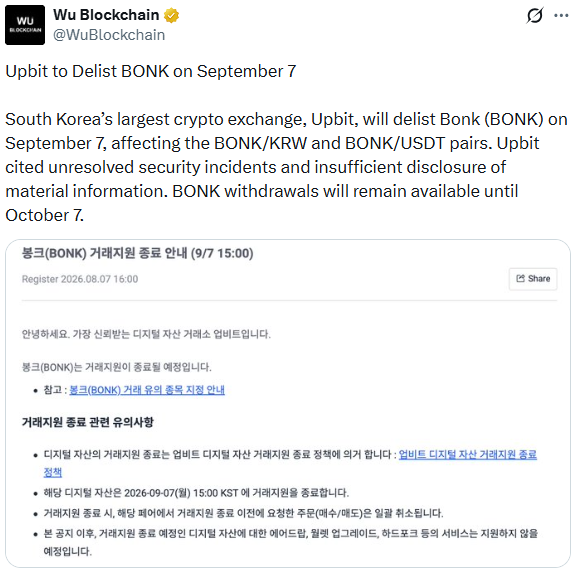
Source: Data From X
The report cites Upbit's own notice, which pointed to unresolved security incidents and insufficient disclosure of material information as the reasons for the removal.
Withdrawals are expected to remain open until October 7, 2026, giving holders a window to move funds.
Note: CoinGabbar could not independently verify the notice beyond what has been reported, and the timing lines up closely with the sharp selloff visible on the chart below.
$BONK Price Prediction Chart: Technical Analysis
Pair: $BONK/USDT · Market: Spot (Crypto) · Exchange: KuCoin · Timeframe: 4H · Source: TradingView · Timestamp: August 8, 2026, 10:33 UTC+5:30
$BONK is trading at $0.000002460; after breaking below the descending triangle, it had been consolidating inside since mid-July.
Price had been grinding along a trendline on one side and a horizontal support zone on the other, and the sharp red candle that broke through that support triggered a fast drop to current levels.
RSI (Relative Strength Index, a momentum gauge from 0 to 100) has fallen to 25.21, deep in oversold territory, reflecting how quickly the selling pressure built up.
The EMA (Exponential Moving Average, a momentum indicator that weights recent candles more heavily) cluster now sits well above price, with EMA 20 at $0.000002643 and EMA 50 at $0.000002760, both acting as resistance after the breakdown.
If the price breaks the current support, keep an eye on the important Fibonacci level.
Another case is if the price breaks $0.000002520 resistance, then it can pull back rather than trend reversal.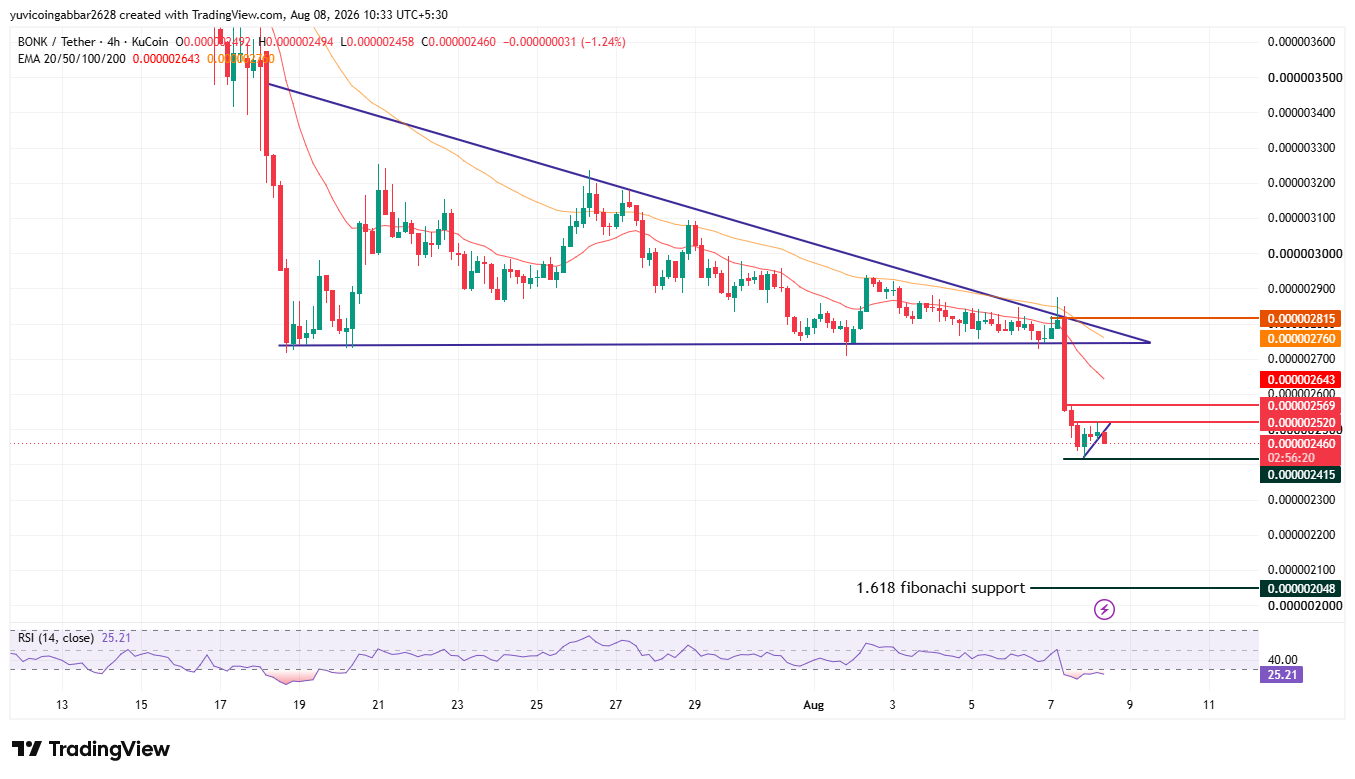
BONK future price: Support and Resistance Levels
Level Type
Price
Resistance 3
$0.000002815
Resistance 2
$0.000002569
Resistance 1 (nearest)
$0.000002520
Immediate Price Reference
$0.000002460
First Support
$0.000002415
Deeper Support (1.618 Fibonacci)
$0.000002048
BONK future price: EMA levels
EMA
Price
EMA 20
$0.000002643
EMA 50
$0.000002760
BONK Forecast: Bull Case vs. Bear Case
$BONK price target 2026 Bull case: If the price sustains at the current level and breaks the upper resistance, the upper levels to watch are $0.000002520 and $0.000002569.
$BONK price target 2026 Bear case: If it breaks below the $0.000002415 support instead, the price can move toward the lower level at $0.000002048.
$BONK price target 2026: Can BONK Reach $0.000002815?
$0.000002815 is the highest resistance level marked on the chart. Reaching it would require $BONK to first reclaim the EMA cluster near $0.000002643 to $0.000002760 and clear the nearer resistances at $0.000002520 and $0.000002569, a multi-stage recovery rather than a quick bounce, especially with sentiment still weighed down by the delisting report.
What Could Invalidate the Bullish Setup?
A rejection at the EMA cluster near $0.000002643 to $0.000002760, followed by continued weakness below $0.000002415, would keep the bearish structure intact.
A confirmed break below $0.000002048 would suggest the selloff still has room to extend.
$BONK Price Prediction 2026: Expert View
According to CoinGabbar analysts, the break below the descending triangle support, combined with RSI dropping to 25.21, points to strong near-term selling pressure rather than a routine pullback.
The timing closely follows the reported Upbit delisting notice, which appears to have added to an already fragile setup after weeks of range-bound trading.
With EMA 20 and EMA 50 both now sitting above price as resistance, the path of least resistance looks lower unless $BONK can reclaim the $0.000002520 to $0.000002569 zone in the sessions ahead.
$BONK Price Prediction: Data Sources
Price, EMA, and RSI data referenced from a 4H $BONK/USDT chart via TradingView on KuCoin, timestamped August 8, 2026, 10:33 UTC+5:30.
Market cap, FDV, volume, and supply data referenced from CoinMarketCap.
Delisting news referenced from a Wu Blockchain report on X.
Disclaimer: This piece is for informational purposes only and isn't financial advice. The levels and scenarios above are based on technical chart analysis and publicly available data at the time of writing, and crypto markets can move sharply within hours, so past patterns don't guarantee future outcomes. It's worth doing independent research and considering your own risk tolerance before acting on any of the levels discussed here.