Can BONK hold $0.00000312 after a fast bounce from $0.00000280? That question sits at the center of today's BONK price prediction, written at 05:00 UTC on October 22, 2026. Buyers pushed the
Can BONK hold $0.00000312 after a fast bounce from $0.00000280? That question sits at the center of today's BONK price prediction, written at 05:00 UTC on October 22, 2026.
Buyers pushed the price up, but sellers pushed back quickly. It's the samereversal or rejection setup that memecoin watchers have discussed before.
BONK Market Snapshot
The $BONK price is up 1.68% in 24 hours, so buyers have the edge for now. This $BONK price prediction starts with the key numbers below.
Metric
Value
Price
$0.000003123
24-hour change
+1.68%
24-hour trading volume
$39.14M
market cap
$274.5M
FDV
$274.3M
Source: Data taken from CoinMarketCap
BONK Open Interest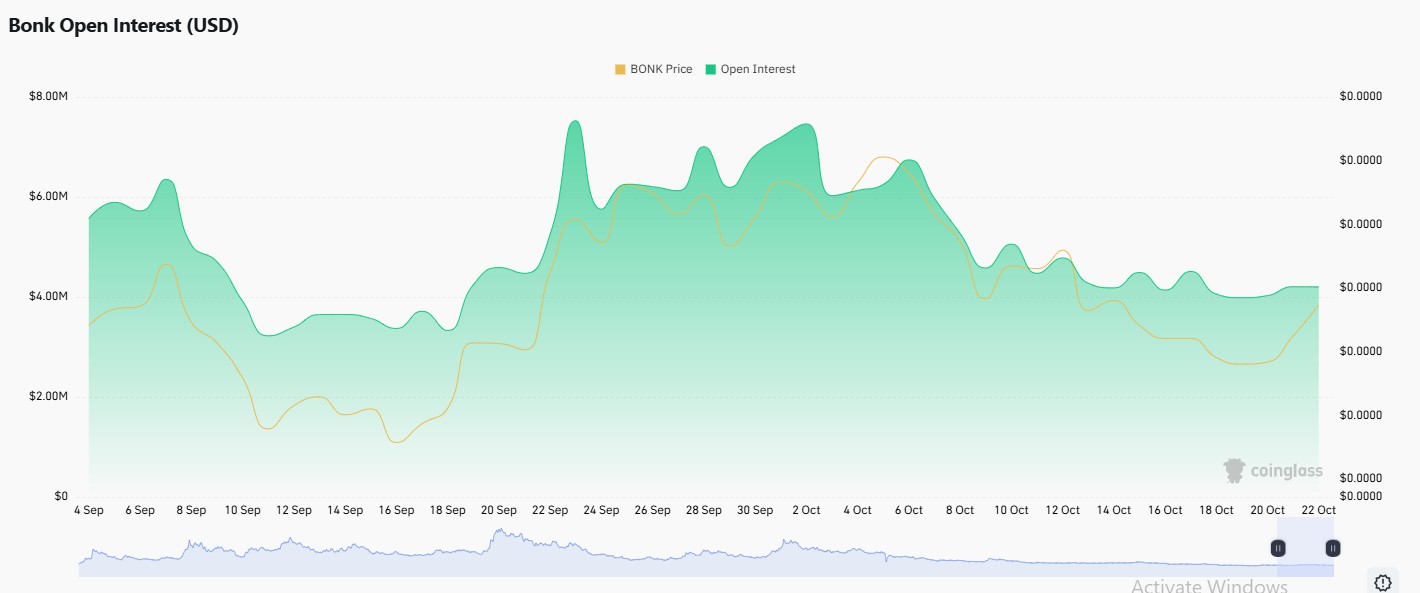
BONK open interest is the total value of open futures contracts. It was near $5.6M on September 4 and spiked toward $7.5M around September 23.
After that, it stayed high into early October and then fell to about $4.2M, based on the latestopen interest data.
The price rose from the low, yet open interest stayed flat. And that means new leveraged money hasn't joined the bounce.
BONK Liquidation Data
$BONK liquidation numbers are small. Freshliquidation data shows $13.33K from longs and $677.35 from shorts over 24 hours.
In the last hour, forced exits totaled only $168.19, all from longs. So even during a bounce, late buyers took the hit.
BONK Volume Across Futures Exchanges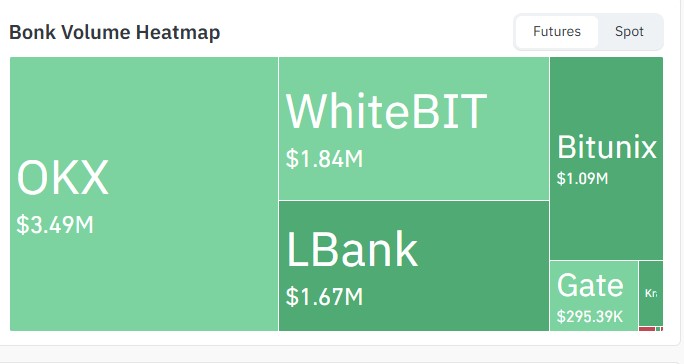
BONK volume on futures platforms is concentrated. Futuresvolume data shows OKX at $3.49M, WhiteBIT at $1.84M, and LBank at $1.67M.
Bitunix adds $1.09M, and Gate Trails at $295.39K. So OKX alone carries over 40% of that group.
BONK Whale Holders Data 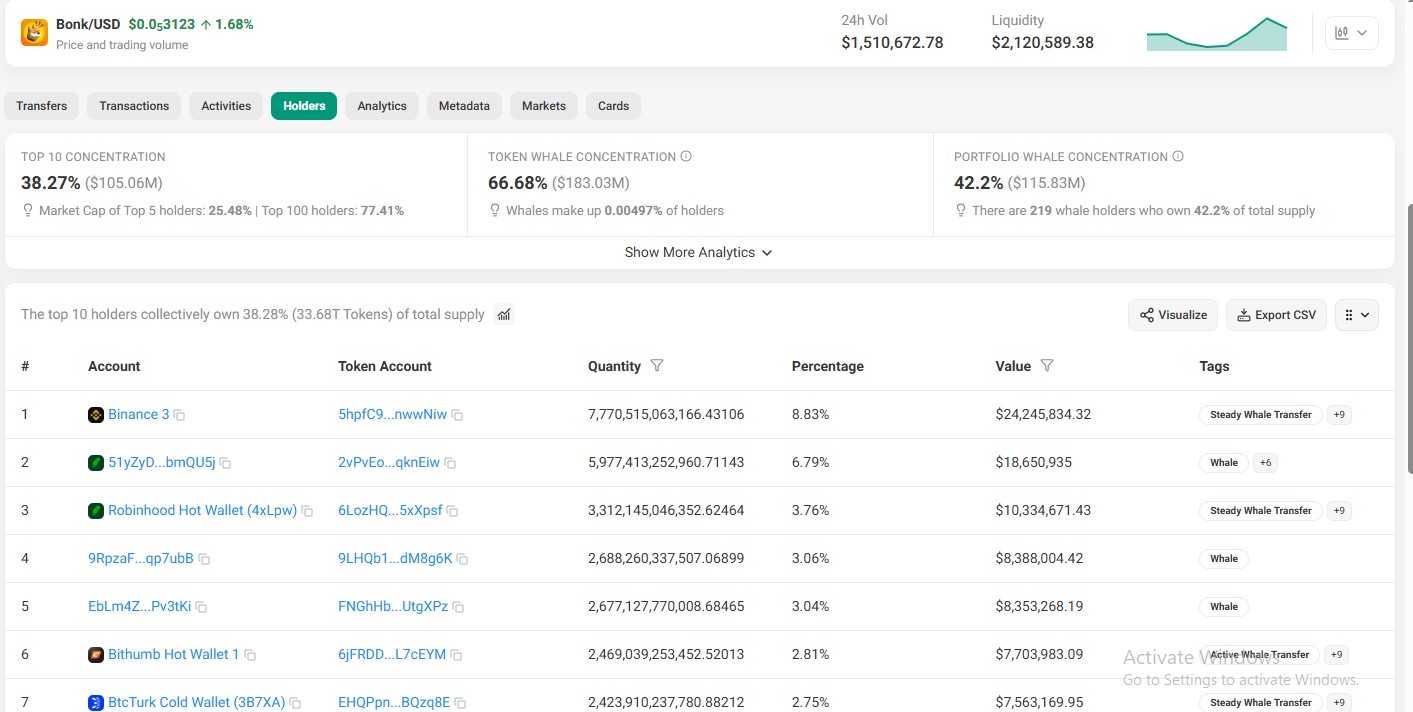
Source: Data taken from Solscan
$BONK whale holders control a big share of supply. The top 10 wallets own 38.27%, worth about $105.06M.
Binance 3 leads with 8.83%, valued near $24,245,834.32, and an unnamed wallet follows with 6.79%.
Such concentration can shake sentiment quickly, as theBONK hack fallout showed. And with 219 whales owning 42.2% of supply, who really decides the next move?
BONK vs Dogecoin and Shiba Inu
Dogecoin trades at $0.08029, down 1.45%. Shiba Inu trades at $0.000005071, down 0.95%. Their market caps are $13.82 billion and $2.98 billion.
$BONK rose while both of them fell, which shows relative strength. But BONK is much smaller, so even modest buying or selling can move it more.
Earlier coverage of thedog-themed memecoin surge showed how fast market mood can change.
BONK Technical Analysis: 4-Hour Chart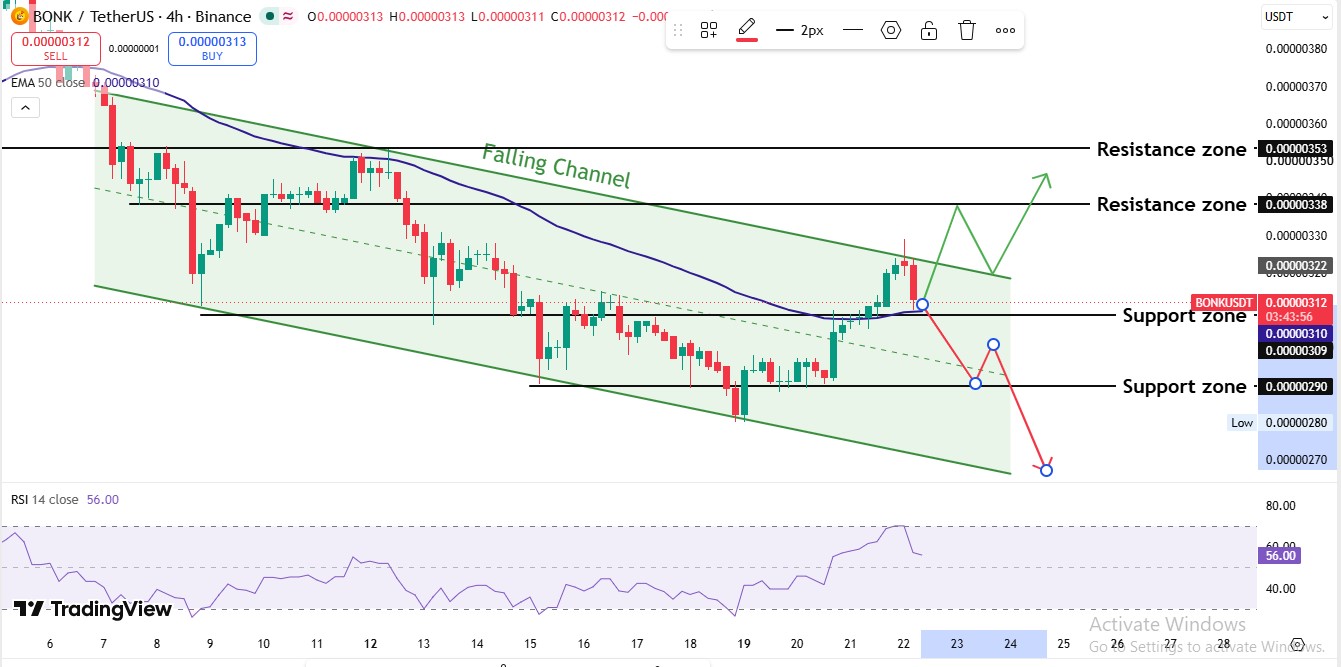
In early October, the price sat near $0.00000368 and then started sliding inside a falling channel, which is a pair of downward lines that keep price in a tilted lane.
Because of that lane, every rally stalled near the top line. And every dip found buyers near the bottom line.
Around October 12, the price pushed toward $0.00000353 and failed. Sellers then took control, and the price slid to $0.00000290 by October 15.
Next came the low near $0.00000280 on October 19. But buyers stepped in right there.
That move lifted the price above the 50-period average and up to about $0.00000329 on October 22. Currently a red candle has appeared at the channel top.
EMA and RSI Readings
The 50-period EMA is an average of recent trading prices, and it sits at $0.00000310. Price is at $0.00000312, so it's sitting right on that line.
RSI measures momentum on a 0 to 100 scale. It reached about 70 earlier on October 22, which means buyers were stretched, and it has since cooled to 56.00. But momentum isn't dead yet.
Support and Resistance Levels
Type
Level
What it means
Resistance 2
$0.00000353
Mid-October swing high
Resistance 1
$0.00000338
Next target after a breakout
Support 1
$0.00000309 to $0.00000310
EMA zone
Support 2
$0.00000290
Mid-October bounce area
BONK Price Prediction: Bull, Base, and Bear Case
Scenario
Trigger
Target
Invalidation
Bull case
Hold above $0.00000310
$0.00000338, then $0.00000353
Loss of $0.00000309
Base case
Price stays near the EMA
$0.00000309 to $0.00000322
Break outside the range
Bear case
Loss of $0.00000309
$0.00000290, then $0.00000270
Move above $0.00000322
The base case in this $BONK analysis is a slow range. Price stays between $0.00000309 and $0.00000322 until buyers or sellers commit.
Bulls have one good card, since Price reclaimed the average. Then again, no, one rally doesn't flip a channel.
The BONK price prediction stance is bearish. The channel is intact and open interest is flat, and the rejection has already happened.
BONK Price Prediction: Final Outlook
Coingabbar’s analysis shows that BONK’s next move depends on the $0.00000310 support level. If the price holds there, it could rise toward $0.00000322.
But if the price falls below that level, $BONK could drop to $0.00000290. Liquidity is thin, so even small trades can cause big swings.
The latestmemecoin crypto news may also change market mood. Timing matters for BONK’s short-term direction.
Disclaimer: This article is for informational purposes only and isn't financial advice. Independent research and a licensed advisor's input should come before any trading decision.