Cardano has been on a strong run lately, and the community has plenty to be excited about, with a fresh governance push aimed at boosting DeFi liquidity across the network. But ADA's chart is
Cardano has been on a strong run lately, and the community has plenty to be excited about, with a fresh governance push aimed at boosting DeFi liquidity across the network.
But ADA's chart is telling a different story right now, and traders chasing the recent rally need to pay attention.
This Cardano Price Prediction looks at whether the momentum that carried ADA higher over the past two weeks can hold, or whether the excitement is running into a wall just as price cools off from its recent highs.
Market data was checked on August 12, 2026, at 12:09 IST.
Cardano Price Prediction Today: Market Overview
Metric
Value
Price
$0.1859
24h Change
-0.96%
Market Cap
$6.78B
FDV
$8.35B
24h Volume
$251.7M
Vol/Mkt Cap (24h)
3.71%
Total Supply
44.99B ADA
Max Supply
45B $ADA
Circulating Supply
36.55B+ $ADA
Source: Data from CoinMarketCap as of August 12, 2026, at 12:09 IST. Figures may vary slightly across other tracking websites.
Cardano Foundation Governance Vote: What the Post Says
Cardano Foundation's official account confirmed it voted YES on a governance action to withdraw 120M ADA for AlphaGrowth1's "Cardano PRIME" program. 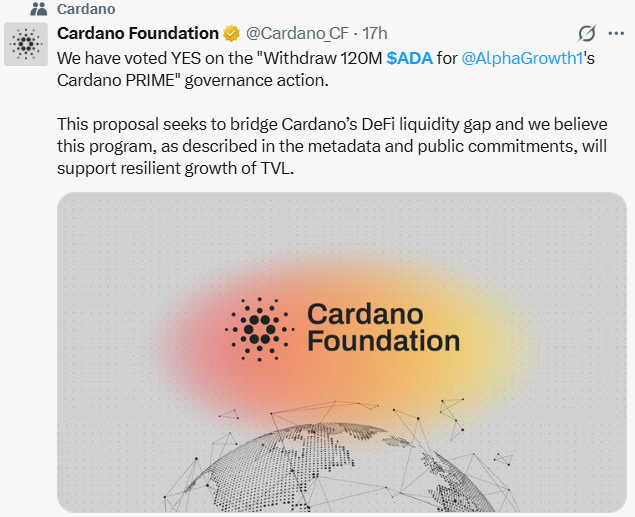
The proposal is aimed at bridging Cardano's DeFi liquidity gap, and the Foundation says it expects the program to support resilient TVL (Total Value Locked, meaning the total value of assets deposited in a network's DeFi protocols) growth going forward.
Since this comes directly from Cardano's official account, it's treated as confirmed rather than an unverified claim, though the actual impact on TVL will depend on how the program gets executed.
ADA Price Rally: What the Post Claims
A post from BSCN highlighted ADA's price momentum, claiming the token rose over 13% in 30 days to reach $0.194, pushing market cap to roughly $7.25B and marking a short-term turnaround despite weaker 90-day and 365-day trends. 
Source: Data From BSCN
The post also pointed to stable network activity, with daily active users ranging between 11,000 and 19,000 recently, including about 16,857 users and 17,626 transactions on August 8.
On the weaker side, the same post noted TVL fell nearly 4% over 30 days and 81.7% over the past year, while chain fees dropped 12% over 30 days, suggesting the rally has been driven more by price momentum than actual DeFi growth.
Note: This section reflects figures reported by a third-party account (BSCN). CoinGabbar has not independently verified these figures.
Cardano Price Prediction Chart: Technical Analysis
Pair: ADA/USDT · Market: Spot (Crypto) · Exchange: KuCoin · Timeframe: 4H · Source: TradingView · Timestamp: August 12, 2026, 12:09 UTC+5:30
ADA is trading at $0.1859, after breaking below the ascending trendline that had supported its climb since late July.
The chart flags a bearish EMA crossover right at current levels, where the EMA 20 has crossed below the EMA 50, a signal that often points to fading short-term momentum.
RSI (14) reads 34.53, leaning weak and edging closer to oversold territory, in line with the recent pullback from the highs near $0.2092.
If the price breaks below the current support, the bearish trend could continue, with the EMAs adding further downside pressure.
As long as the price stays below the EMAs, any short-term bounce should be seen as just a pullback, not a real reversal.
But if the price breaks above the $0.1983 resistance and moves past the EMAs, that would be an early sign the trend could be turning bullish. 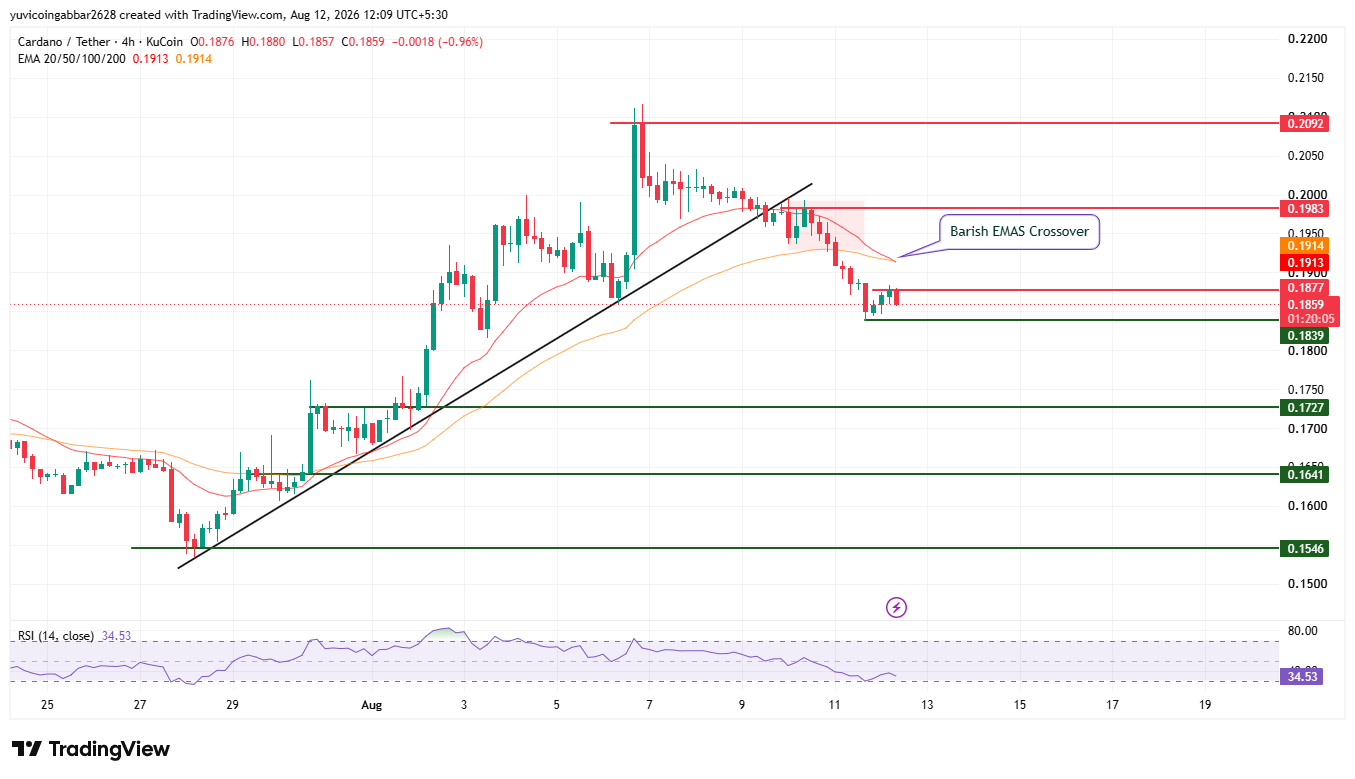
Support and Resistance Levels
Level Type
Price
Resistance 2
$0.2092
Resistance 1
$0.1983
Nearest Resistance
$0.1877
Immediate Price Reference
$0.1859
First Confirmed Support
$0.1839
Deeper Support
$0.1727
Structural Support
$0.1641
Structural Floor
$0.1546
EMA Levels
EMA
Price
EMA 20
$0.1913
EMA 50 (initial recovery level)
$0.1914
Cardano Forecast: Bull Case vs. Bear Case
ADA price target 2026 Bull case: Holding above the first confirmed support at $0.1839 and reclaiming the nearest resistance at $0.1877 would ease the pressure from the bearish crossover.
A move back above the EMA 20/EMA 50 zone near $0.1913 to $0.1914 would open the path toward $0.1983 and eventually $0.2092.
ADA price target 2026 Bear case: A break below $0.1839 would confirm the bearish crossover is playing out as expected and put the recent rally in real doubt.
Losing $0.1727 would expose $0.1641 and then the structural floor at $0.1546 as downside levels.
ADA Price Target: Can ADA Reach $0.2092?
$0.2092 is the highest resistance level marked on the chart.
Reaching it would require ADA to first reclaim the nearest resistance at $0.1877, clear the EMA 20/EMA 50 zone around $0.1913 to $0.1914, and then break and hold above $0.1983, a multi-stage recovery that looks unlikely while the bearish crossover is still in play.
What Could Invalidate the Bullish Setup?
A close below the first confirmed support at $0.1839 would suggest the bearish crossover is taking hold.
A further break below $0.1727 and the structural levels at $0.1641 and $0.1546 would undermine the recent rally entirely and point to a deeper correction.
Cardano Price Prediction: Expert View
According to CoinGabbar analysts, ADA's pullback from recent highs, combined with the bearish EMA crossover, suggests short-term momentum has cooled after a strong two-week run.
The governance vote to fund Cardano PRIME is a genuine long-term positive for DeFi liquidity, but it won't offset near-term technical pressure if $0.1839 fails to hold.
BSCN's data pointing to falling TVL and chain fees, even as price and user activity held up, reinforces that this rally has leaned more on momentum than fundamentals.
The $0.1839 to $0.1914 range is the key zone: reclaiming it would ease crossover pressure, while losing it would confirm the bears are back in control.
Disclaimer: This piece is for informational purposes only and isn't financial advice. The levels and scenarios above are based on technical chart analysis and publicly available data at the time of writing, and crypto markets can move sharply within hours, so past patterns don't guarantee future outcomes. It's worth doing independent research and considering your own risk tolerance before acting on any of the levels discussed here.