XRP is trading at $1.348 today, up 4.02% in 24 hours. The bounce comes after the token dipped to about $1.25 on October 19. Traders now want to know if this move can last. Analyst Javon Marks
XRP is trading at $1.348 today, up 4.02% in 24 hours. The bounce comes after the token dipped to about $1.25 on October 19.
Traders now want to know if this move can last.
Analyst Javon Marks says the coin looks ready to head toward $15. The chart and derivatives data show a more careful picture for now.
What Is the XRP Price Today?
Here is the current XRP price snapshot.
Metric
Value
Current price
$1.348
24-hour change
+4.02% (+$0.0521)
Market cap
$84.86 billion
Futures volume (24h)
$2.50 billion
Spot volume (24h)
$483.45 million
Open interest
$2.99 billion
Circulating supply
63.12 billion
Total supply
99.98 billion
Max supply
100 billion
Futures volume rose 24.12%. Spot volume is much smaller.
Most of the action is in derivatives, not regular buying and selling.
What Is the XRP News Today?
Javon Marks posted that the coin looks ready to extend toward a macro target of $15 or more. He says breakouts are holding and the alt market looks to be lining up.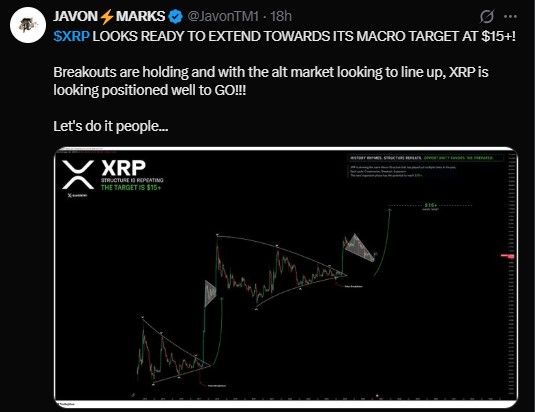
His chart is titled "structure is repeating." It shows past breakouts and one more leg up.
Egrag Crypto has also marked $15 as the "Valhalla Scenario." That target has not been revised.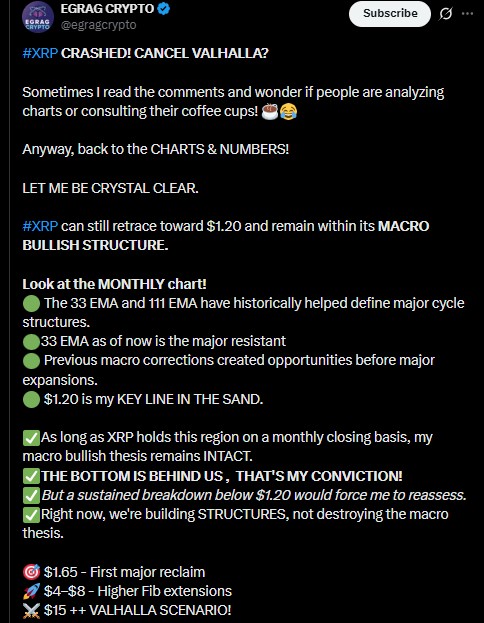
What Is the XRP Price Prediction for Today? (4-Hour Chart)
The 4-hour Binance chart shows a falling channel. Price made lower highs and lower lows from late September, when it was near $1.65.
The latest candle opened at $1.3464 and closed at $1.3485. Its high was $1.3497, and its low was $1.3427. Volume on the chart was 2.49 million.
Price sits above the 20 EMA ($1.3190) and the 50 EMA ($1.3310). RSI reads 62.54, above its average line at 51.93.
But the 100 EMA ($1.3639)and the 200 EMA ($1.3867) is still above the price.
What Is the XRP Price Forecast Based on Support and Resistance?
Watch these levels on the 4-hour chart.
Level
Type
What It Is
$1.42 to $1.45
Upside zone
Possible area if a breakout holds
$1.3867
Resistance
200 EMA
$1.3639
Resistance
100 EMA
$1.3310
Support
50 EMA
$1.3190
Support
20 EMA
$1.30
Support
Round number and recent base
$1.27
Stronger support
Below the recent bounce
If buyers clear $1.36 to $1.39, the next stop could be $1.42 to $1.45.
If price gets rejected near $1.36, a move back to $1.33 or $1.30 is possible. The October 19 low near $1.25 is the next mark below $1.27.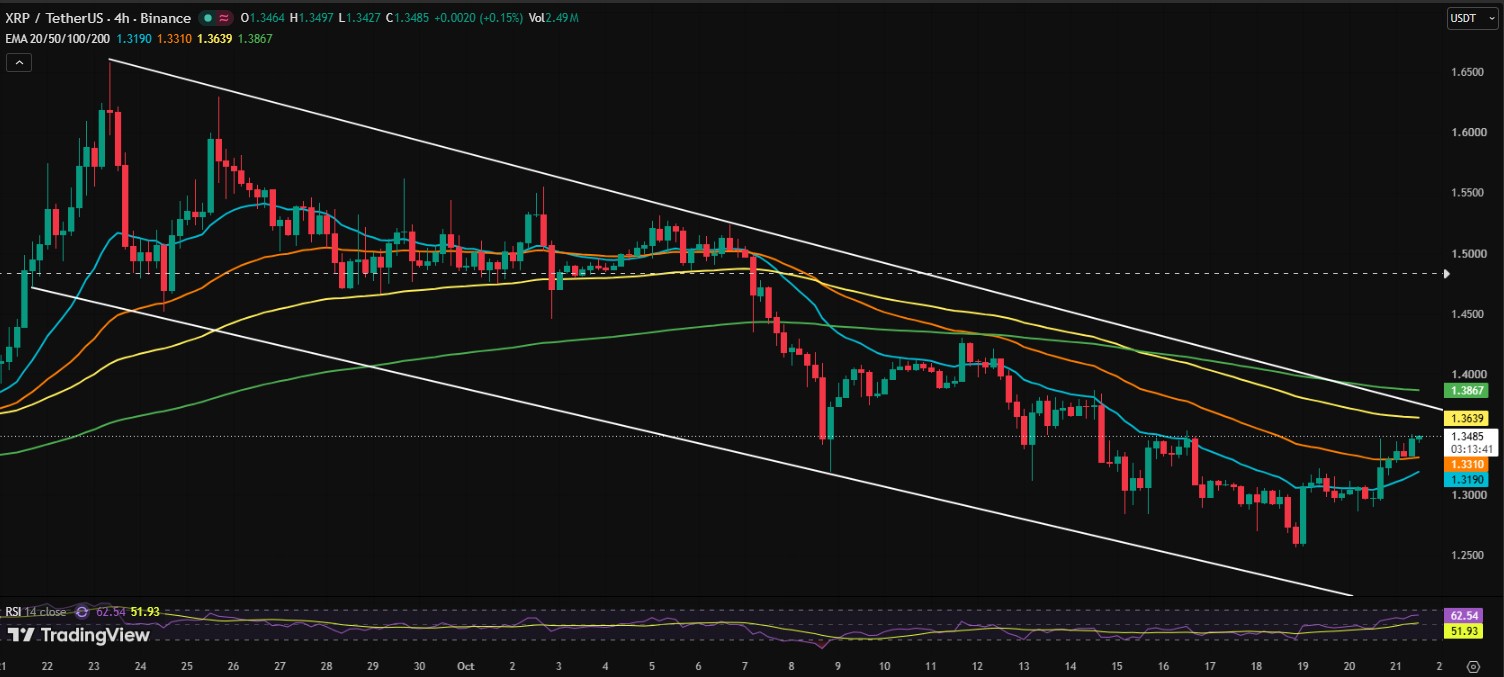
Why Is XRP Going Up Today?
Open interest grew 4.57% to $2.99 billion. More money is entering futures.
Options open interest rose 3.31% to $71.97 million. Options volume fell 2.51% to $4.01 million.
Short sellers also lost money as price rose. That forced buying can add fuel to a bounce.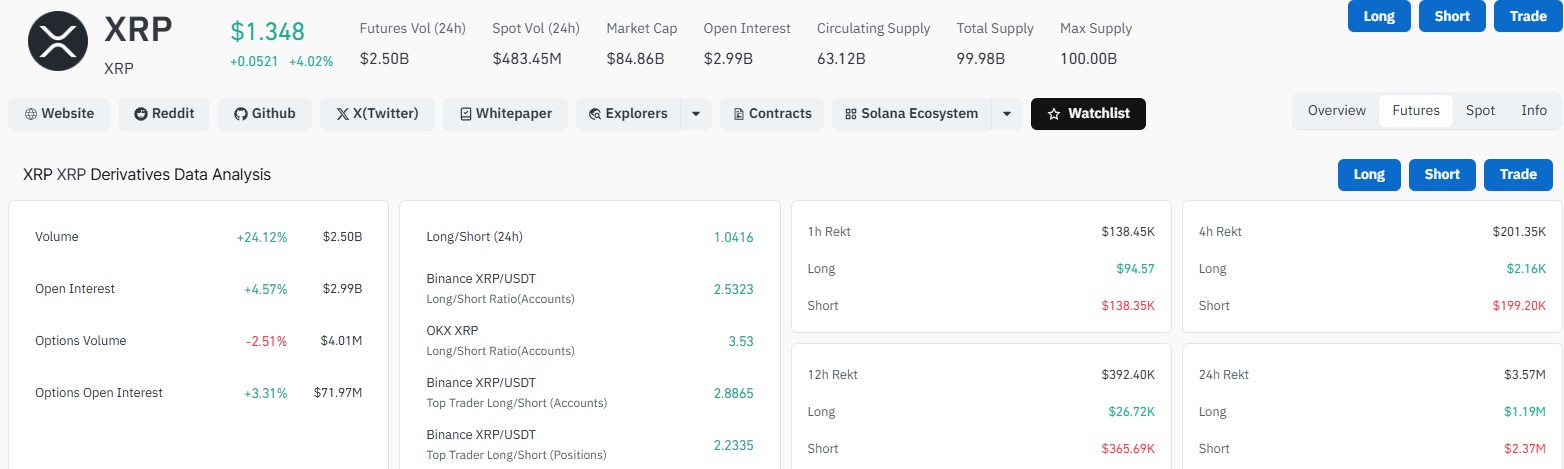
What Does the XRP Long/Short Ratio Show?
A ratio above 1 means more longs than shorts. The overall reading is 1.0416, which is almost even.
Account-based ratios lean much more bullish.
Long/Short Ratio
Reading
Overall (24h)
1.0416
Binance XRP/USDT (accounts)
2.5323
OKX XRP (accounts)
3.53
Binance top traders (accounts)
2.8865
Binance top traders (positions)
2.2335
Account ratios count people, not money size. Position ratios from top traders are lower, but still favor longs.
Why Are XRP Shorts Being Liquidated?
Shorts took the bigger hit in every time frame.
Period
Total Liquidated
Longs
Shorts
1 hour
$138.45K
$94.57
$138.35K
4 hours
$201.35K
$2.16K
$199.20K
12 hours
$392.40K
$26.72K
$365.69K
24 hours
$3.57M
$1.19M
$2.37M
A short squeeze can lift price fast. It can also fade once the forced buying ends.
Can XRP Reach $15? Latest XRP News and Ripple Price Prediction
From $1.348, a move to $15 is about 11 times higher. That is a gain of roughly 1,013%.
With 63.12 billion coins in circulation, $15 would mean a market cap near $947 billion. Today it is $84.86 billion.
Egrag Crypto's chart draws a path to $15 from the current consolidation zone. It follows an arc from past cycle peaks on the monthly chart back to 2013.
One metric in the shared notes sits near 0.92. That suggests many traders are in net losses. Past cycles often offered lower risk at such levels than when holders sit on big profits.
None of this is a promise. Chart targets are views, not facts.
Is XRP Bullish or Bearish Right Now?
The short-term mood looks cautiously bullish. Price is above two EMAs, and longs lead in most ratios.
Still, the token trades inside a falling channel. A clean break above the trendline and the 200 EMA would be a stronger sign of a trend change.
Until then, a pullback to $1.33 or $1.30 stays possible. Sudden reversals are common in crypto.
Disclaimer
This article is for information only. It is not financial, investment, or trading advice. Crypto prices are very volatile, and you can lose some or all of your money. Price targets are opinions and are not guaranteed. Do your own research before you make any decision.