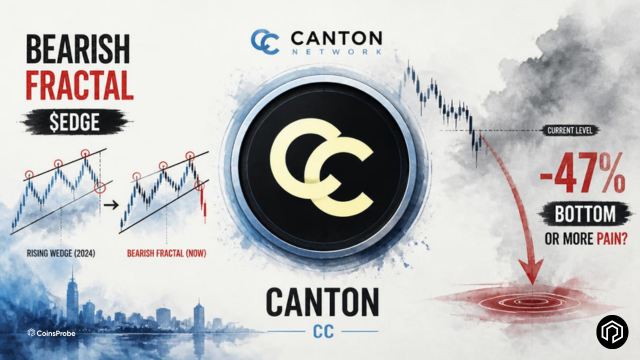
Key Highlights Canton Coin (CC) is down 9.66% in 24 hours and 24.19% over the past 7 days. CC broke down from a rising wedge near $0.15, coinciding with its 200-day moving average — a classic
Key Highlights
- Canton Coin (CC) is down 9.66% in 24 hours and 24.19% over the past 7 days.
- CC broke down from a rising wedge near $0.15, coinciding with its 200-day moving average — a classic bearish breakdown signal.
- The token has already fallen roughly 47% from its local top near $0.17, mirroring a fractal seen in EdgeX (EDGE) earlier in June 2026.
- If the bearish fractal plays out fully, the next major support sits at $0.05862 — approximately 33% below current prices.
- The bearish outlook only invalidates on a sustained reclaim of the 200-day MA at $0.1493.
Canton Coin (CC) is flashing one of the more technically defined bearish setups in the current altcoin market — a rising wedge breakdown that closely mirrors the structure EdgeX (EDGE) printed before its 75% collapse in June 2026. With CC already down 47% from its local top and showing no confirmed signs of reversal, the fractal comparison is drawing serious attention from technical traders.
CC is currently trading at approximately $0.09050, down 9.66% in the last 24 hours and 24.19% over the past 7 days. The token carries a market capitalization of around $3.55 billion.
 Canton (CC) Price on 07 Aug 2026/Source: Coinmarketcap
What Is Canton Coin (CC)?
Canton is the native utility token of the Canton Network, a privacy-focused Layer-1 blockchain built specifically for institutional finance and real-world asset (RWA) tokenization.
The network is designed to bridge traditional finance (TradFi) and blockchain infrastructure, with a core emphasis on compliance, configurable privacy, and institutional-grade interoperability. These characteristics place Canton in a distinct category from consumer-facing blockchains — it is purpose-built for the segment of the market where regulatory alignment and privacy controls are non-negotiable requirements.
Within the network, CC serves two primary functions: paying network fees (which are subsequently burned) and rewarding participants under a burn-mint equilibrium model — a tokenomics structure designed to create natural supply regulation tied to actual network usage.
Bearish Fractal — CC Mirrors the EdgeX (EDGE) Collapse
Our chart comparison, based on insights from market analyst @Divergent_XBT (X), suggests that Canton Coin (CC) is following a bearish fractal similar to EdgeX (EDGE).
The EDGE Precedent
In June 2026, EDGE broke down from a rising wedge pattern — a bearish technical structure characterized by price making higher highs and higher lows within converging trendlines, before failing to sustain the upward trajectory and reversing sharply. Following the wedge breakdown, EDGE collapsed by 75%, one of the sharper corrections seen among mid-cap altcoins in that period.
 EDGE and Canton (CC) Fractal Chart-Coinsprobe/Source: Tradingview
CC’s Near-Identical Structure
Canton Coin has now printed what analysts describe as a nearly identical structure. CC broke below its own rising wedge near the $0.15 region — a level that also coincided with its 200-day moving average, adding technical weight to the breakdown signal.
The convergence of a wedge breakdown and a loss of the 200-day MA at the same price level is a meaningful bearish confirmation. The 200-day MA is widely watched by institutional and retail traders alike as the primary dividing line between long-term bullish and bearish trend structures.
Since that breakdown, CC has already fallen approximately 47%, sliding from around $0.17 to its current price near $0.0905 — tracking the early stages of the EDGE fractal with notable precision.
![Canton Coin CC Bearish Fractal Chart]
Potential Downside Target — $0.05862
If the fractal continues to develop in line with EDGE’s post-breakdown trajectory, the next major technical support for CC sits at $0.05862.
Reaching this level from current prices would represent:
- Approximately 33% further downside from $0.0905
- An overall 65% correction from CC’s local top near $0.17
The $0.05862 level is the primary area where buyers would be expected to step in based on prior price structure — making it the key level to watch if CC continues declining without finding meaningful support before then.
Key Invalidation Level — $0.1493 (200-Day MA)
The bearish fractal thesis is not without a clear exit condition. The setup begins to weaken materially if CC reclaims its 200-day moving average, currently sitting at $0.1493.
A sustained move and daily close above $0.1493 would do two things simultaneously: invalidate the current bearish fractal structure and signal that buyers have absorbed the wedge breakdown — shifting the technical bias back toward bullish. From the current price of $0.0905, reclaiming the 200-day MA would require approximately +65% upside — a significant move that would need a meaningful catalyst or broad altcoin market recovery to materialize.
Until that reclaim happens, the path of least resistance on the chart remains to the downside.
Bearish Scenario: CC fails to reclaim $0.1493, fractal continues tracking EDGE’s post-breakdown move, price extends toward $0.05862 — a full 65% correction from the local top.
Bullish Scenario: CC stabilizes at current levels, builds a base above $0.0905, and stages a recovery toward the 200-day MA at $0.1493. A sustained reclaim of that level with volume would invalidate the bearish fractal and open the path toward prior wedge support turned resistance.
Bottom Line
Canton Coin is under clear and technically defined downward pressure. The rising wedge breakdown near $0.15 — which also marked the loss of the 200-day moving average — set up a fractal structure that closely mirrors the EDGE collapse from June 2026. With 47% already surrendered from the local top and no confirmed reversal signal yet on the chart, the technical setup currently favors further downside toward $0.05862.
Canton’s institutional positioning in the RWA space gives it stronger fundamental footing than most memecoins facing similar chart pressure. But fundamentals rarely override technicals in the short term — and until CC reclaims $0.1493, the bearish fractal remains the dominant framework to trade against.
Disclaimer: The views and analysis presented in this article are for informational purposes only and reflect the author’s perspective, not financial advice. Technical patterns and indicators discussed are subject to market volatility and may or may not yield the anticipated results. Investors are advised to exercise caution, conduct independent research, and make decisions aligned with their individual risk tolerance.
Also Read: Bitcoin Whales Accumulate as Retail Sells — Long-Term Chart Signals Major $BTC Bottom?