Canton (CC) is back on trader radars after snapping out of a months-long downtrend, and the latest Canton price prediction talk is centered on whether this bounce has more room to run. The to
Canton (CC) is back on trader radars after snapping out of a months-long downtrend, and the latest Canton price prediction talk is centered on whether this bounce has more room to run.
The token was changing hands near $0.1199 at writing time, holding well above the lows it carved out in August as market watchers reassess the setup for this institutional-focused Layer-1 network.
This updated read looks at derivatives positioning, market data, and the chart to gauge where CC could head next.
Derivatives Traders Stay Split as Open Interest Holds Firm
According to CoinGlass data, open interest across CC derivatives held near $37.92 million, staying firm through the recent price swing.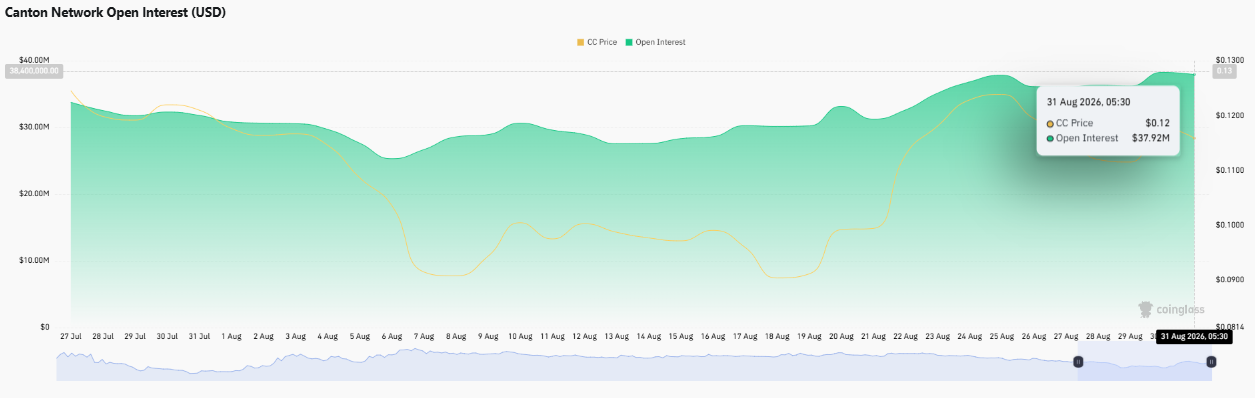
Positioning looked mixed: the Binance CC/USDT long/short ratio read 1.52 in favor of longs, while OKX traders sat closer to even at 0.98, and Binance's top-trader accounts leaned long even as top-trader positions skewed short.
Liquidations stayed light at roughly $16.68K over 24 hours, split between $11.46K in longs and $5.22K in shorts.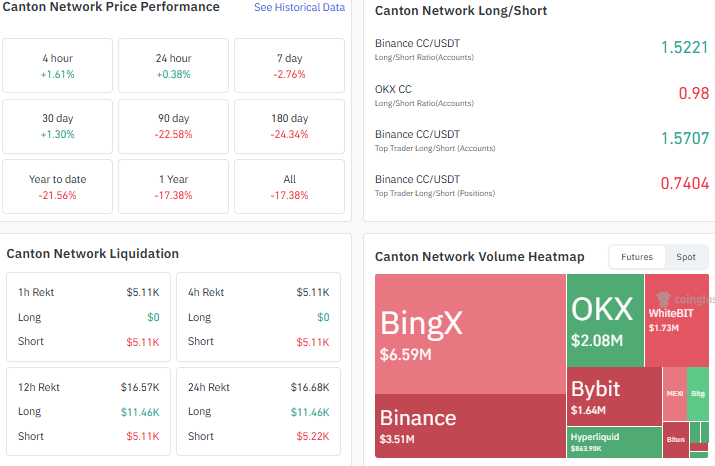
BingX led futures volume at $6.59 million, ahead of Binance and OKX, as per CoinGlass data.
On performance, $CC gained 1.61% over 4 hours and edged up 0.38% for the day, but it's still down 2.76% weekly, 22.58% over 90 days, and about 21.56% year-to-date.
Market Cap, Supply and Network Activity Snapshot
As perCoinMarketCap data, Canton's market cap sits at $4.69 billion on 24-hour volume near $17.81 million, a volume-to-market-cap ratio of about 0.38%.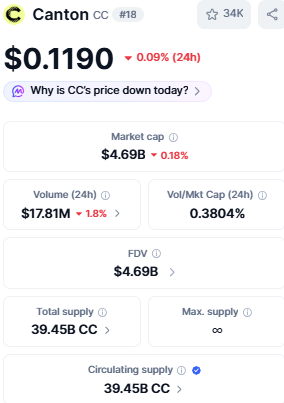
Fully diluted valuation matches market cap at $4.69 billion since CC carries no maximum supply cap, with circulating and total supply both near 39.45 billion tokens.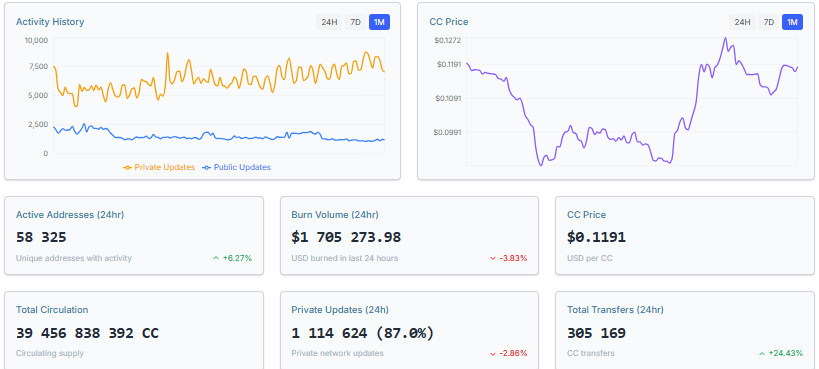
On-chain activity has been climbing too: active addresses rose 6.27% to 58,325 and total transfers jumped 24.43% to 305,169 in a day, according to network data from CantonScan.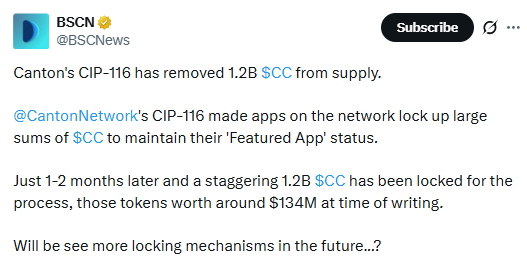
Network burns removed close to $1.7 million worth of $CC in 24 hours, while CIP-116 has locked up 1.2 billion $CC, worth roughly $134 million, as apps compete to secure Featured status on the network.
Rising activity alongside shrinking liquid supply is a combination this Canton price prediction is keeping a close eye on.
Canton (CC) Bull vs Bear vs Neutral Outlook
Weighing both sides is useful context for any Canton price prediction, so here's how the bullish, bearish, and neutral signals currently stack up.
Bullish Factors
Bearish Factors
Neutral Factors
Broke out of a months-long descending channel
Still down over 90 days and year-to-date
Long/short ratios split across exchanges
Old resistance near $0.1146 now acting as support
Top-trader positions on Binance skew short
RSI at 58.28, out of neutral but not overbought
Active addresses and transfers rising sharply
Price remains far below 2026 highs
Liquidations balanced with no major flush either way
1.2B CC locked via CIP-116, tightening liquid supply
Weekly performance still in the red
Volume-to-market-cap ratio steady near 0.38%
Canton Price Chart: Old Resistance Now in Focus as Support
As per the TradingView chart, CC broke out of a descending channel that had capped price since June, and the former resistance zone near $0.13863 has since flipped into support.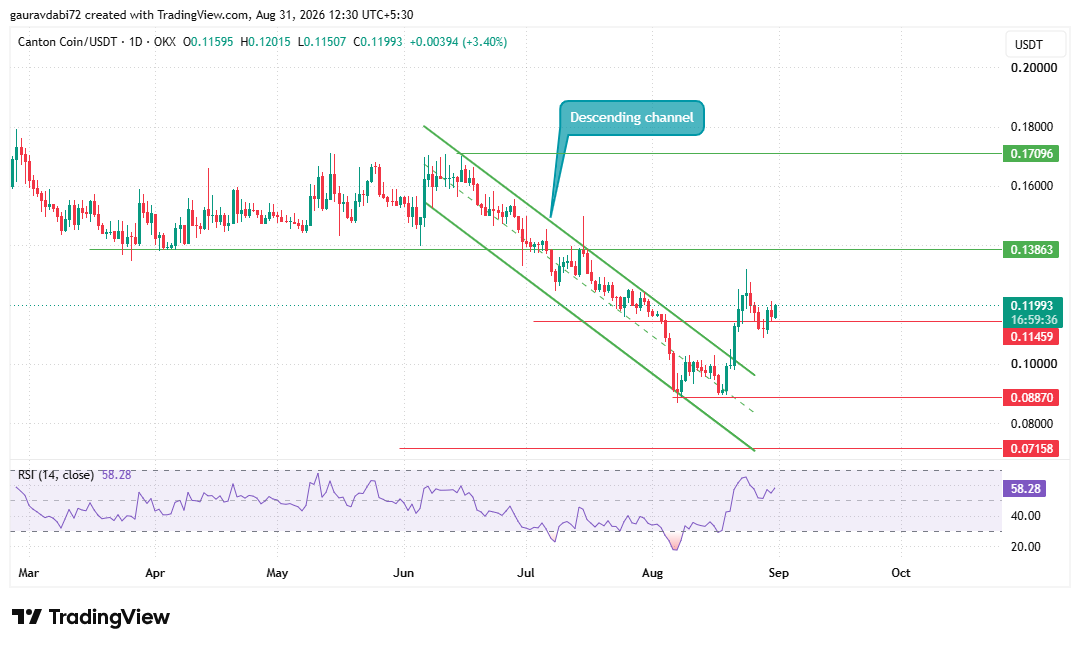
Immediate resistance sits at $0.1386, with a bigger hurdle at $0.1710 above that. Support layers below sit at $0.11459, $0.08870, and $0.07158.
The 14-day RSI reads 58.28, showing momentum that has cleared neutral territory without yet turning overbought.
This chart setup is central to the current Canton price prediction: if the $0.1146 support zone continues to hold, the coin can go toward $0.1710 and potentially beyond.
Analyst View
According to the CoinGabbar analyst desk, Canton's move above its old resistance-turned-support zone hints that the broader multi-month downtrend may be cooling off, though the split long/short data across exchanges shows traders are still cautious about confirming a full reversal.
This desk view remains a key input for any near-term Canton price prediction, and every updated read from here will likely hinge on whether buyers can defend the $0.1146 zone on any retest.
Disclaimer: This article is for informational purposes only and does not constitute financial, investment, or trading advice. Cryptocurrency markets are highly volatile and unpredictable; readers should conduct their own research before making any decisions. CoinGabbar and the author bear no responsibility for losses incurred based on this content.