Cap just got a fresh reason to trend, and this one came out of nowhere. Something pulled the spotlight back onto this token overnight, and traders are still scrambling to catch up. Cap Price
Cap just got a fresh reason to trend, and this one came out of nowhere. Something pulled the spotlight back onto this token overnight, and traders are still scrambling to catch up.
Cap Price Prediction Today: A Listing Headline Nobody Saw Coming
Cap price prediction conversations exploded the moment Bithumb confirmed a fresh listing for the token. It's the kind of news that catches even regular $CAP watchers off guard.
Bithumb is one of Korea's biggest exchanges, and a new market addition there tends to pull in fresh eyes. Cap Labs Limited confirmed the listing directly.
KuCoin also published a deep breakdown of the protocol's institutional credit model, and Bybit added a leveraged perpetual contract on top of it.
So is this just noise, or does it actually change anything for where $CAP goes next, especially withaltcoin market trends leaning shaky this week?
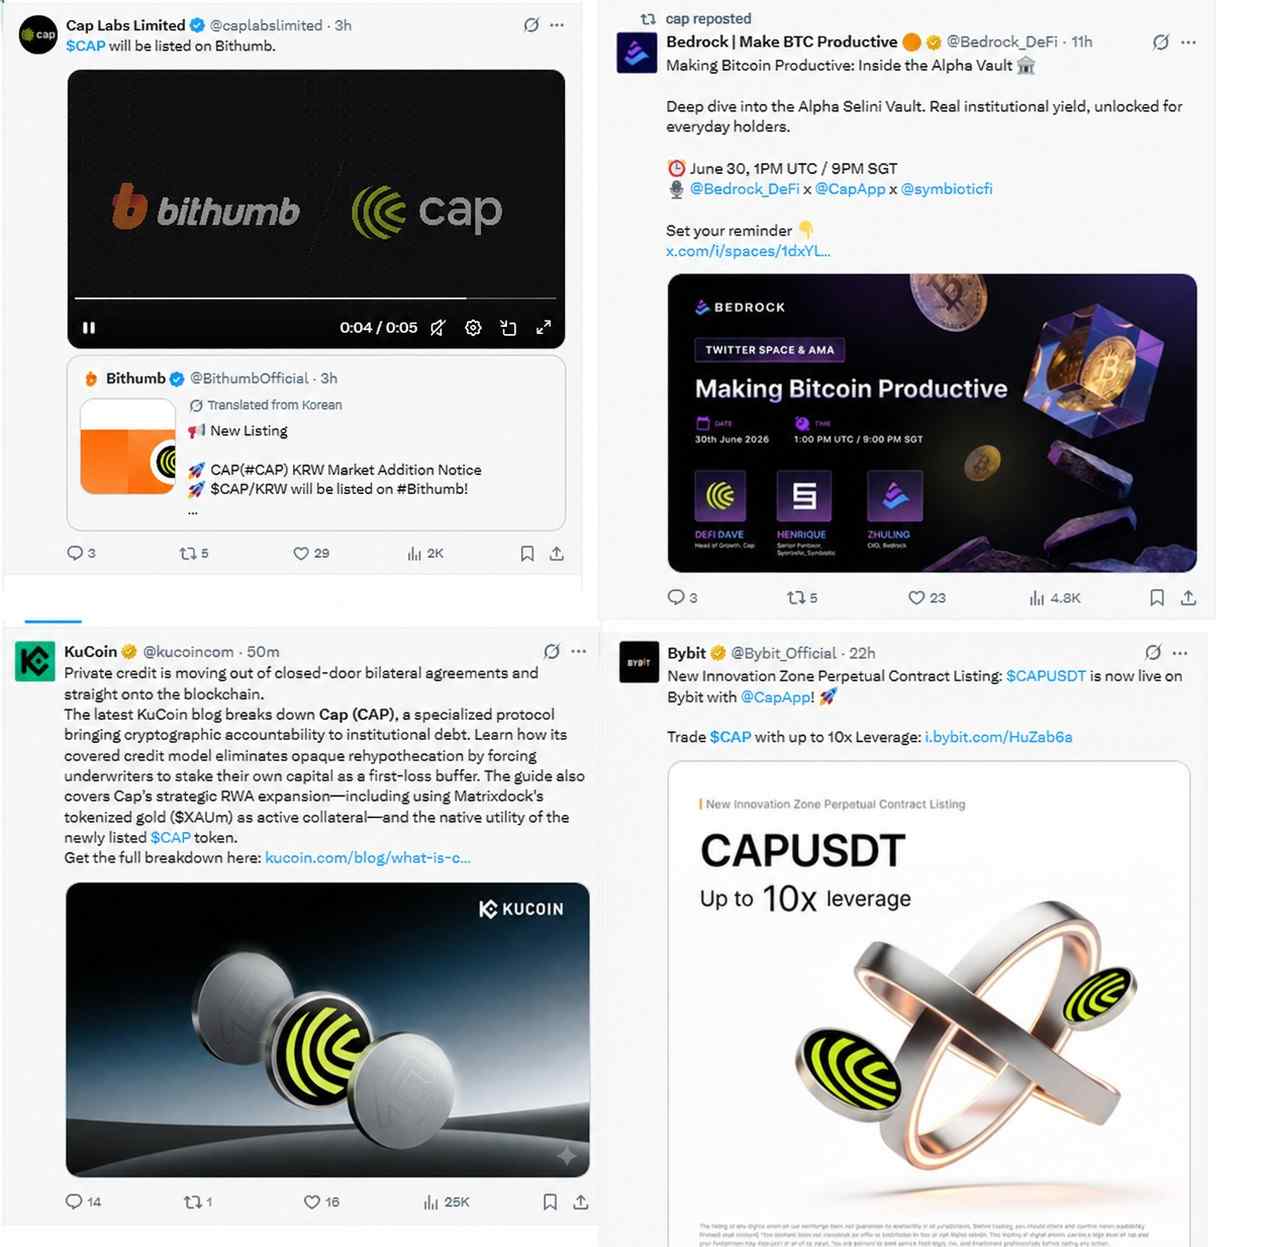
Source: Posted on X
Bybit Adds CAPUSDT Perpetual Listing With Up to 10x Leverage
Bybit confirmed its own listing news within hours of the Bithumb announcement, opening up a CAPUSDT perpetual contract for traders chasing leveraged exposure.
Source: Posted on X by Bybit (@Bybit_Official)
What Exactly Is a Cap and Why Do Builders Keep Mentioning It?
Cap is a protocol built around bringing institutional-style credit onto the blockchain, the kind of project that keeps showing up acrossblockchain crypto news. Basically, it wants lenders and borrowers to operate without the usual closed-door agreements.
It runs as a token labeled CAP, sitting among mid-tier names by market value. The project pitches itself as financial infrastructure, not a meme.
Why This Coin Is Getting Real Attention Beyond the Hype Cycle
Here's the thing: most tokens get noticed for pumps. $CAP got noticed this week for actual product news.
KuCoin's blog post explained how Cap's covered credit model forces underwriters to stake their own capital first. That's a first loss buffer, and it matters for anyone studying the protocol's risk design.
The piece also touched on Cap using tokenized gold through Matrixdock as active collateral, an unusual angle for a DeFi credit token. Bybit going live with a CAP/USDT perpetual at up to 10x leverage adds another layer of trader interest, the kind of action usually reserved fortop memecoins and major large caps.
Source: Posted on X by KuCoin (@kucoincom)
Cap Coin Overview: Quick Snapshot Before We Go FurtherMetricDetailCoin NameCapTicker SymbolCAPBlockchainEthereum-basedToday High$0.03247Today Low$0.02256RSI Level29.95Token TypeUtility / Credit Protocol TokenToken CategoryRWA and Institutional CreditMarket Cap$38.09M24H Trading Volume$73.8MCirculating Supply1.56B CAP24H Change+2.63%
Source: Data by CoinMarketCap
$CAP Liquidation Data Tells a Sharper Story Than the Price Chart
Liquidations over 24 hours hit $681.38K total. Longs took the bigger hit at $353.07K against $328.31K on shorts.
That's a fairly even split, leaning slightly toward squeezed longs. Fine. The 4-hour window alone saw $406.48K wiped out.
Source: Cap liquidation data by CoinGlass
Cap Volume Heatmap Shows Where the Real Trading Is Happening
OKX and Binance carry most of the action, posting $49.91M and $45.91M, respectively. Bybit isn't far behind at $26.37M.
Smaller exchanges pick up the rest, and this kind of spread acrosscrypto exchanges matters when a coin is this reactive to news.
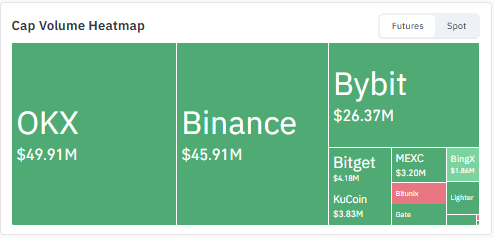
Source: Cap volume heatmap by CoinGlass
Cap Technical Price Analysis: What the Chart Is Actually Saying
Breaking: $CAP is still trading inside a descending channel on the 4-hour chart. Price sits at 0.02483 right now.
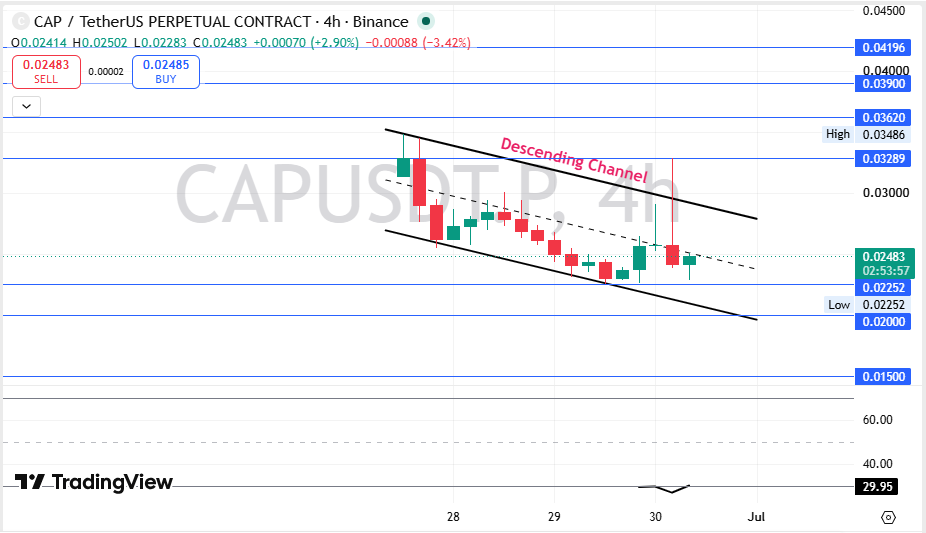
Source: Charting by TradingView
The structure shows lower highs and lower lows. Sellers have held the upper hand for a while now.
RSI is sitting at 29.95. That usually means selling pressure is getting stretched thin.
We pulled up the chart, and the first thing that stood out was how tightly price hugs the lower boundary of that channel. Buyers haven't fully stepped in yet, but the setup is getting tense.
Immediate support sits at 0.02252. A break below would weaken the entire structure fast.
On the upside, resistance is layered at 0.03289 and then 0.03620. A breakout above the first level, backed by real volume, could shift momentum quickly.
But here's what most traders are missing: oversold RSI inside a falling channel near Bithumb listing news is exactly the kind of setup that produces sharp reversals.
$CAP Short-Term Price Prediction: Next Few Days Could Get Loud
The short-term picture depends on whether listing momentum holds. A close above 0.02850 would be the first sign buyers are stepping back in.
TimeframeBearish TargetBase TargetBullish TargetKey Trigger24 Hours$0.02300$0.02550$0.02850Reaction to Bithumb listing trading volume3–7 Days$0.02150$0.02700$0.03289Channel breakout confirmation2–4 Weeks$0.01950$0.02900$0.03620Sustained exchange inflow demand
Watch the 0.02252 support closely. Lose it, and the short-term story flips fast.
Cap Long-Term Price Prediction: Does the Bigger Picture Hold Up?
The long-term case rests on whether Cap's credit model pulls in real borrowers, not just traders chasing headlines.
TimeframeBearish TargetBase TargetBullish TargetCatalyst Needed3 Months$0.01800$0.03100$0.04200A new tier-1 exchange listing6 Months$0.01500$0.03500$0.05000Growth in active credit lending volumeEnd of Year$0.01300$0.04000$0.06500A major institutional borrower joins the platform2027 Outlook$0.01000$0.04800$0.08000Expansion of RWA collateral beyond gold-backed assets
And that raises a bigger question: one the market hasn't answered yet. Whether real credit demand shows up, or this stays a trading vehicle. The long-term case looks moderate, not weak but not proven either.
Three $CAP Price Scenarios Worth Watching This Cycle
Worst Case:Price breaks below 0.02252 and the channel keeps pressing lower. Triggered by fading listing hype and no new buyer demand.
Base Case: The $CAP holds the channel and chops between support and resistance. Most realistic path if no major news follows this week's events.
Best Case: A clean breakout above 0.03289 on strong volume. Needs continued exchange momentum plus real lending activity to back it up.
ScenarioPrice RangeWhat Triggers ItWorst Case$0.01700 - $0.02100Channel breakdown as market hype fadesBase Case$0.02250 - $0.02900Sideways consolidation within the current trading channelBest Case$0.03300 - $0.04300Channel breakout supported by strong volume confirmationKey Cap Price Levels to Watch Before Making Any Move
Resistance zone:0.03289, then 0.03620. A close above with volume opens room toward the channel top.
Support zone: 0.02252. This has held as the floor through recent selling pressure.
Invalidation zone: Below 0.02000. A close here would break the entire bearish-to-neutral thesis and demand a fresh read.
Cap Analyst View and Final Thoughts: Where This Setup Is Really Heading
The chart still leans bearish; no point softening that. $CAP remains inside a descending channel with sellers in control.
RSI at 29.95 keeps this from looking purely negative, similar to readings showing up on the broaderFear and Greed Index lately. Oversold readings this deep often precede at least a short bounce.
A weekly close above 0.02850 would be the first real sign buyers are absorbing supply. Until then, the trend stays the seller's game.
Beyond the chart, watch whether Cap's RWA and credit narrative keep pulling exchange attention, since anyone trackingcrypto price predictions in this cycle knows how fast that edge can fade.
The most important level on the board right now is 0.02252. Hold it, and there's room to argue for stabilization. Lose it, and the bearish case gets louder fast.
This is one of those setups where the news and the chart are telling two different stories right now.
Disclaimer: This article is for educational purposes only and does not constitute financial advice. Crypto markets are volatile. Consult your investment advisor before making any investment decision.