Cardano (ADA) is currently priced at $0.18. Indicators hint that the uptrend may weaken. July 6 opened with mixed sentiment in the market, and both red and green charts were found across the
- Cardano (ADA) is currently priced at $0.18.
- Indicators hint that the uptrend may weaken.
July 6 opened with mixed sentiment in the market, and both red and green charts were found across the assets. Among them, Cardano (ADA) is struggling to regain its lost momentum. It has lost a modest 1.94% in value, currently trading at around $0.1863. It can be considered under pressure as bears pave the way.
If it succeeded in attracting the bulls into the charts, it’s easy to escape the downside trading pattern. It is worth noting that the technical structure may turn firmly bearish, with the price trend confirming that negative momentum continues to dominate the broader ADA market.
At press time, Cardano’s price is holding above the daily low at around $0.1855, and its daily high is noted within the $0.1933 range. Moreover, the daily trading volume of the asset has plunged by 43.15%, reaching the $490.51 million zone. Consequently, the Coinglass data has reported that the ADA market has seen a liquidation of $1.72 million.
Key Support and Resistance Levels to Watch for Cardano
Cardano’s 4-hour price pattern shows that if the bears turn powerful, the crucial support might be at $0.1841, followed by a level below $0.1817. A continued downside brings in a deeper zone between $0.1748-$0.1801 are notable areas that determine whether the asset stalls here or continues to fall.
On the flip side, once the bulls show up, the first recovery level of ADA could be at around $0.1886. Assuming a push on the upside happened, the price would hit $0.1908. A potential move above the $0.1969 mark confirms that buyers are gaining control and may target the next resistance levels.
What is the Technical Pattern of ADA Pointing to?
Cardano’s recent momentum reveals that the Moving Average Convergence Divergence (MACD) line is situated below the signal line. With both lines above the zero line, it suggests that the uptrend is weakening, even though the broader trend remains positive.
This setup hints at a slowdown in buying pressure and may lead to consolidation. However, as long as both indicators stay above the zero line, the overall uptrend remains intact.
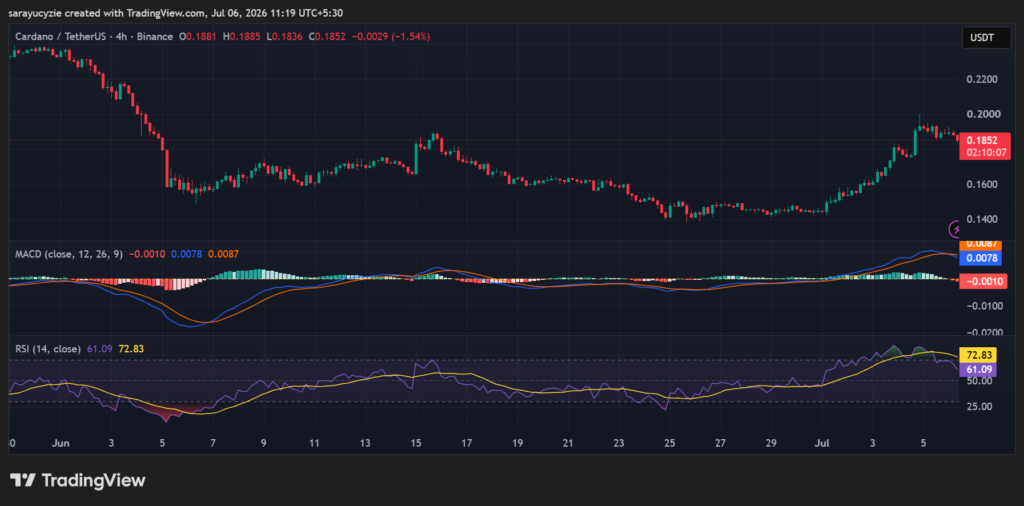 (Source: TradingView)
Furthermore, the daily Relative Strength Index (RSI) reading found at 61.09 indicates healthy bullish momentum within the ADA market. As it is sitting above the neutral level, 50, the buyers continue to have the upper hand.
At the same time, it remains below the overbought zone, and there is still room for the uptrend to extend if the buying interest remains strong.
Crypto Market Highlights
Notcoin (NOT) Turns Green Again: Can Bulls Build on the 8% Rise?