Key Takeaways Cardano maintains its position around $0.16, supported by a crucial weekly demand zone spanning $0.14 to $0.17 Weekly RSI indicators show one of the most extreme oversold condit
Key Takeaways
- Cardano maintains its position around $0.16, supported by a crucial weekly demand zone spanning $0.14 to $0.17
- Weekly RSI indicators show one of the most extreme oversold conditions in ADA’s trading history
- Technical analysts identify an emerging inverse head-and-shoulders formation awaiting confirmation
- Primary resistance barrier located between $0.224 and $0.236; successful breach could propel prices toward $0.31
- Technical fair value projections place ADA at $0.56, with extended targets reaching $4.55
Cardano (ADA) currently exchanges hands around the $0.16 level, registering a decline of approximately 1.88% in the last 24-hour period. The cryptocurrency maintains a market capitalization hovering near $6.07 billion, accompanied by daily transaction volume of roughly $188 million.
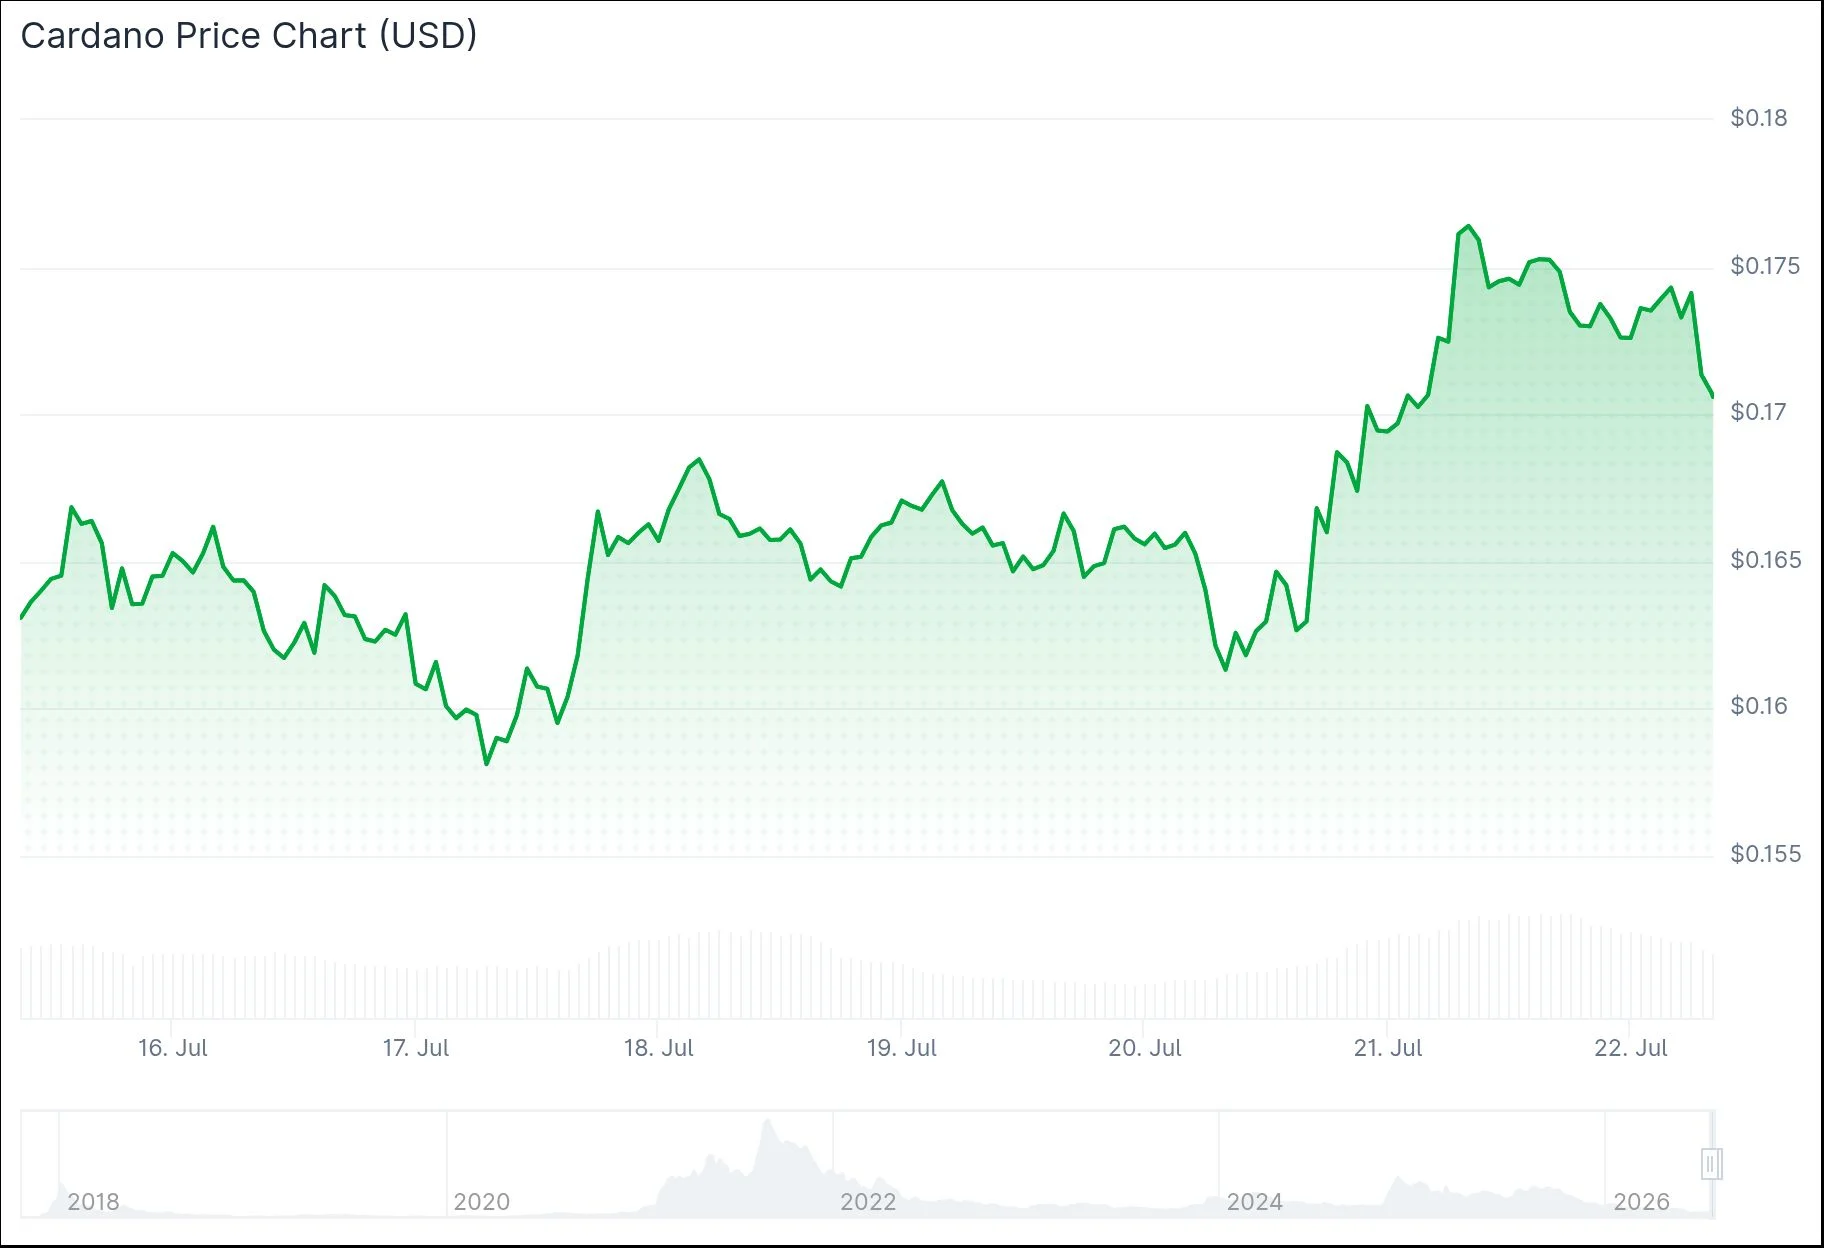 Cardano (ADA) Price
The digital asset currently rests marginally above a significant weekly demand region that market observers have been monitoring with particular attention. This critical zone extends from $0.14 through $0.17 and has consistently absorbed selling pressure across multiple attempts.
While bearish pressure remains evident, successive downward movements are demonstrating diminishing strength. Market technicians interpret this behavior as a potential indication that downward momentum may be exhausting itself.
Technical analyst Master of Crypto highlighted on X that Cardano has been establishing consecutive higher lows within an ascending channel formation. According to his assessment, the price has climbed above $0.175 following a rebound from support, positioning the subsequent objective near $0.219 — representing approximately 25% appreciation potential from present values.
Weekly RSI Indicators Hit Unprecedented Oversold Levels
Cardano’s weekly Relative Strength Index has descended to among its most extreme oversold zones throughout its historical data. Technical analyst Quantum Ascend drew attention to this development on X, emphasizing $0.14 as the critical foundation and $0.236 as the primary obstacle for any upward trajectory.
While deeply oversold RSI conditions don’t provide absolute assurance of trend reversal, they frequently materialize when downward pressure reaches excessive extremes. Such conditions typically create more favorable risk-reward scenarios for prospective buyers entering positions.
Should Cardano maintain stability above the $0.14 threshold, the base-building framework remains viable. Conversely, a decisive move beneath this level might leave the token vulnerable to additional downside toward the subsequent support region around $0.10.
Market analyst CryptoJack has detected a prospective inverse head-and-shoulders configuration taking shape on shorter timeframe charts. The pattern’s components—left shoulder, central head, and right shoulder—are materializing within the $0.16 to $0.17 price corridor.
This technical formation remains unvalidated at present. Cardano must successfully penetrate above the neckline established by recent local peaks to confirm the pattern.
Upon confirmation, initial upside objectives would target the $0.18 to $0.19 zone, followed by advancement toward the $0.224 to $0.236 resistance cluster. Analyst The Boss has projected additional upside milestones at $0.3136, $0.3825, and $0.4488 based on weekly chart analysis.
An independent analyst calculated ADA’s theoretical fair value at $0.56 utilizing their proprietary technical indicator framework. Their research also pinpointed a support corridor between $0.11 and $0.17 that has undergone numerous tests dating back to 2022.
The immediate resistance barrier on daily charts is positioned near $0.23. Should accumulation activity strengthen beyond this point, Cardano could advance toward $0.32, according to that technical evaluation.
Current weekly momentum indicators have yet to reflect substantial increases in purchasing demand, maintaining uncertainty around the sustainability of any potential upward movement at this juncture.
The post Cardano (ADA) Hovers at $0.16 as RSI Plunges to Historic Oversold Levels appeared first on Blockonomi.



 Next Buy Level: $0.10