Cardano has been under heavy bearish pressure as the price has dropped back to levels last seen in 2020, reflecting the growing weakness across the market. What’s more concerning is that the
Cardano has been under heavy bearish pressure as the price has dropped back to levels last seen in 2020, reflecting the growing weakness across the market. What’s more concerning is that the bulls have shown little interest in accumulating at these lower levels, which signals fading confidence despite the sharp correction. After losing the crucial support around $0.19, the ADA price has now entered an important demand zone, and how the price reacts here could shape the next move.
At the same time, network activity has picked up, suggesting traders are becoming more active amid the volatility. However, the recent spike in activity appears to be driven more by panic selling and repositioning rather than fresh accumulation, adding to the bearish sentiment. If ADA fails to reclaim lost levels and hold this demand zone, the possibility of a deeper drop toward the key $0.10 support could become increasingly likely.
ADA Price Breaks Key Support as Bears Tighten Their Grip
The weekly chart of Cardano shows the token breaking below the crucial $0.19–$0.20 support zone, a level that had acted as a strong base for several months. This breakdown is significant because it not only weakens the short-term structure but also places ADA below a key bullish order block, signaling that sellers are gaining control.
Right below the current price, ADA is now trading within a major weekly demand zone between $0.14 and $0.16, which also aligns with a previously formed bullish order block. This area has historically attracted strong buying pressure, making it a crucial region for bulls to defend. If buyers manage to hold this range, it could trigger a short-term relief bounce.
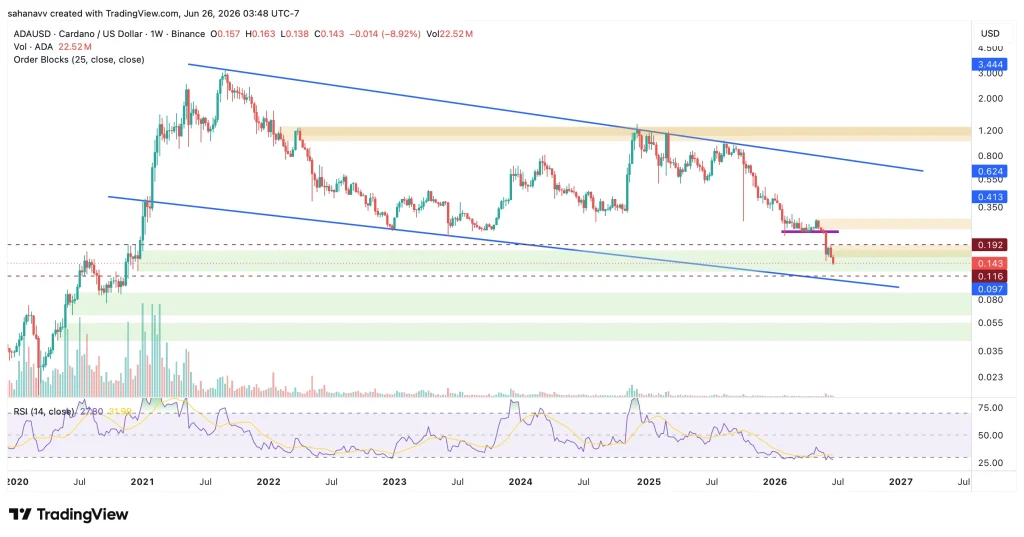
The larger chart structure remains trapped within a descending broadening channel, which keeps the macro trend under bearish pressure. At the same time, the lower green order blocks between $0.08 and $0.10 now emerge as the next major downside liquidity zone if the current demand fails. This makes the ongoing reaction near $0.14 even more important.
Meanwhile, the RSI has slipped into oversold territory, hinting that selling pressure may be exhausting. But unless ADA reclaims the broken order block above $0.19, the broader structure remains vulnerable to further downside.
Cardano’s On-Chain Activity Surges Despite Price Weakness
While the price chart looks fragile, Cardano’s on-chain data tells a different story. Over the past six months, the network’s daily active users have surged by more than 1992%, showing a sharp rise in ecosystem participation despite ADA trading near multi-month lows.
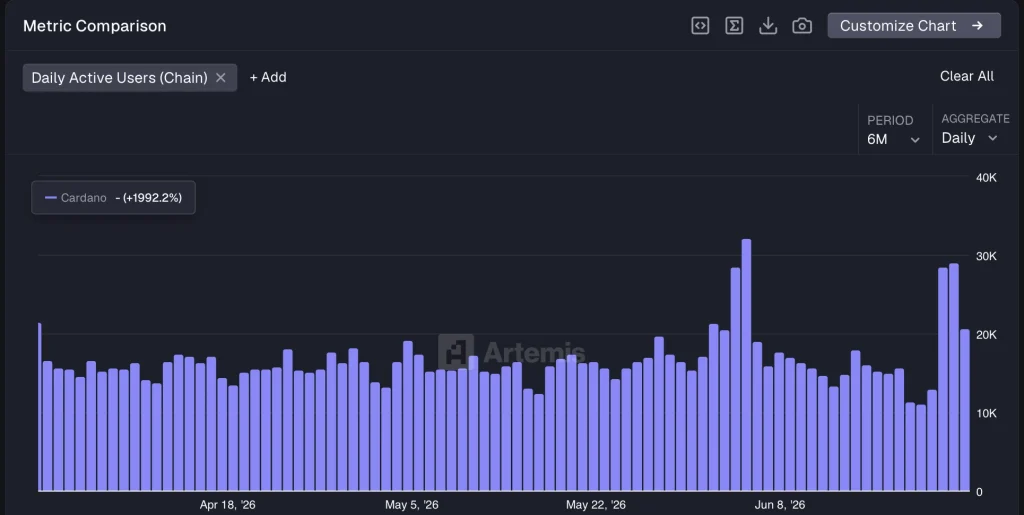
The recent spikes in active users, especially in early and late June, suggest that the market is far from inactive. This kind of growth often points toward increased engagement, stronger transaction flow, and possible long-term accumulation.
This creates an interesting divergence—while the token continues to face short-term selling pressure, the network itself appears to be growing. Historically, such divergences can signal that the market may be undervaluing the asset, although it does not remove the risk of further downside in the near term.
The Bottom Line: What’s Next for Cardano Price Rally?
Cardano price now sits at a crucial point where both technical and on-chain signals are colliding. On one side, the price remains under heavy pressure after losing a major support zone, keeping the short-term trend bearish. On the other hand, the sharp rise in network activity suggests the ecosystem remains active and could be building a stronger long-term base.
If ADA manages to defend the $0.14–$0.16 demand zone and reclaim $0.19, the token could trigger a recovery toward $0.24 and possibly $0.30. However, if current support fails, bearish pressure may intensify, dragging the price toward $0.10 and even $0.08. For now, ADA remains at a decisive level, with both buyers and sellers fighting for control.