Cardano price prediction is back in the spotlight after $ADA has broken below a key support zone that had recently flipped from resistance into support, shifting the short-term market structu
Cardano price prediction is back in the spotlight after $ADA has broken below a key support zone that had recently flipped from resistance into support, shifting the short-term market structure toward a bearish bias.
The move has changed the near-term picture completely, and where $ADA goes from here depends on whether that lost zone gets reclaimed or not.
Quick Take: ADA is trading near $0.1632. This is a short-term read based on the 1-hour chart and should be rechecked if the price closes decisively beyond either $0.1656 or $0.1606.
Cardano Price Right Now
Metric
Value
Price
$0.1632
24h Change
-2.28% (-$0.003805)
Market Cap
$5.95B
Futures Volume (24h)
$260.02M
Spot Volume (24h)
$34.18M
Open Interest
$394.18M
Circulating Supply
36.48B ADA
Total Supply
44.99B ADA
Max Supply
45.00B ADA
The price is taken from the live TradingView chart, with volume, market cap, open interest, and supply figures fromCardano data on CoinGlass, as of July 25, 2026, around 11:05 AM IST.
Methodology And Data Sources
This Cardano price prediction uses the 1-hour ADA/USDT chart on Binance via TradingView for price structure, with volume, open interest, and market cap figures from CoinGlass and liquidation flow from CoinGlass's ADA liquidation tracker.
All levels are treated as invalidated only on a confirmed 1-hour candle close beyond the stated trigger, not an intraday wick. For a broader read on where ADA heads next, our Cardano price forecast $ADA next move coverage tracks this same structure as it develops.
Why Is ADA Under Pressure Today
As per Cardanians on X, beyond the chart, there is a longer-term structural story building around Cardano.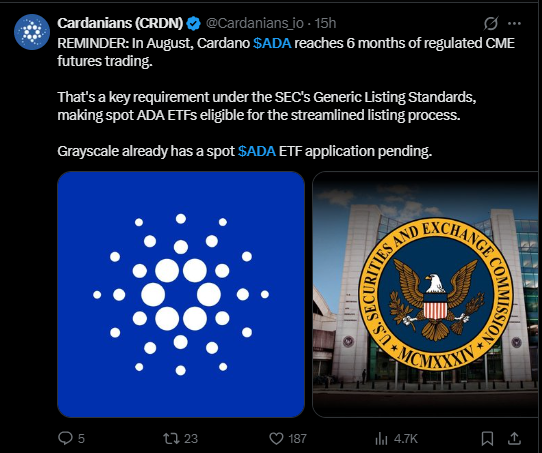
According to Cardanians and publicly available CME trading records, ADA is set to reach six months of regulated CME futures trading in August.
Under the SEC's Generic Listing Standards, six months of regulated futures trading can satisfy one of the requirements used when exchanges seek approval for certain spot crypto ETFs. It does not guarantee approval but may simplify the listing process.
That would make spot ADA ETFs eligible for the streamlined listing process.
Grayscale already has a spot ADA ETF application pending, so this milestone is being watched as a potential catalyst further out.
None of that changes the near-term picture, though, where $ADA has just lost a key support zone and is trading with a bearish tilt on the lower timeframe.
Cardano Liquidation Data Today
Liquidation activity over the past day shows longs taking the bulk of the damage as ADA broke down.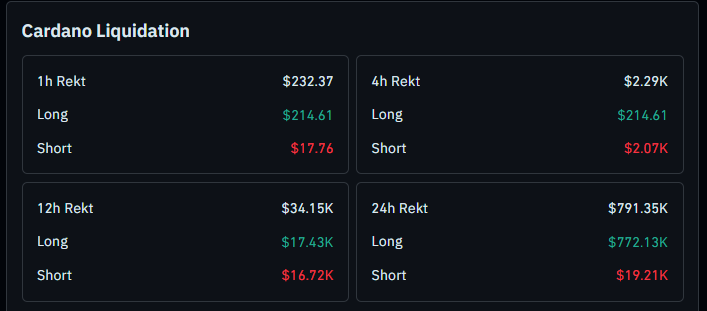
Over the past hour, $232.37 was liquidated, split between $214.61 in longs and $17.76 in shorts. The 4-hour figure comes in at $2.29K in total, with $214.61 from longs and $2.07K from shorts.
The wider windows tell an even more lopsided story. Over 12 hours, total liquidations reach $34.15K, made up of $17.43K in longs and $16.72K in shorts, a fairly even split. Across the full 24 hours, liquidations hit $791.35K, and longs account for $772.13K of that figure, while shorts make up just $19.21K.
The liquidation imbalance supports the bearish price action, suggesting that leveraged long positions were forced to exit during the breakdown.
on the chart, showing leveraged buyers got caught out as the flip zone gave way. The full data set is available throughADA liquidation tracking on CoinGlass.
Cardano Price Prediction: 1-Hour Chart Analysis
$ADA had been climbing inside a rising wedge for several sessions, and that wedge eventually broke to the upside.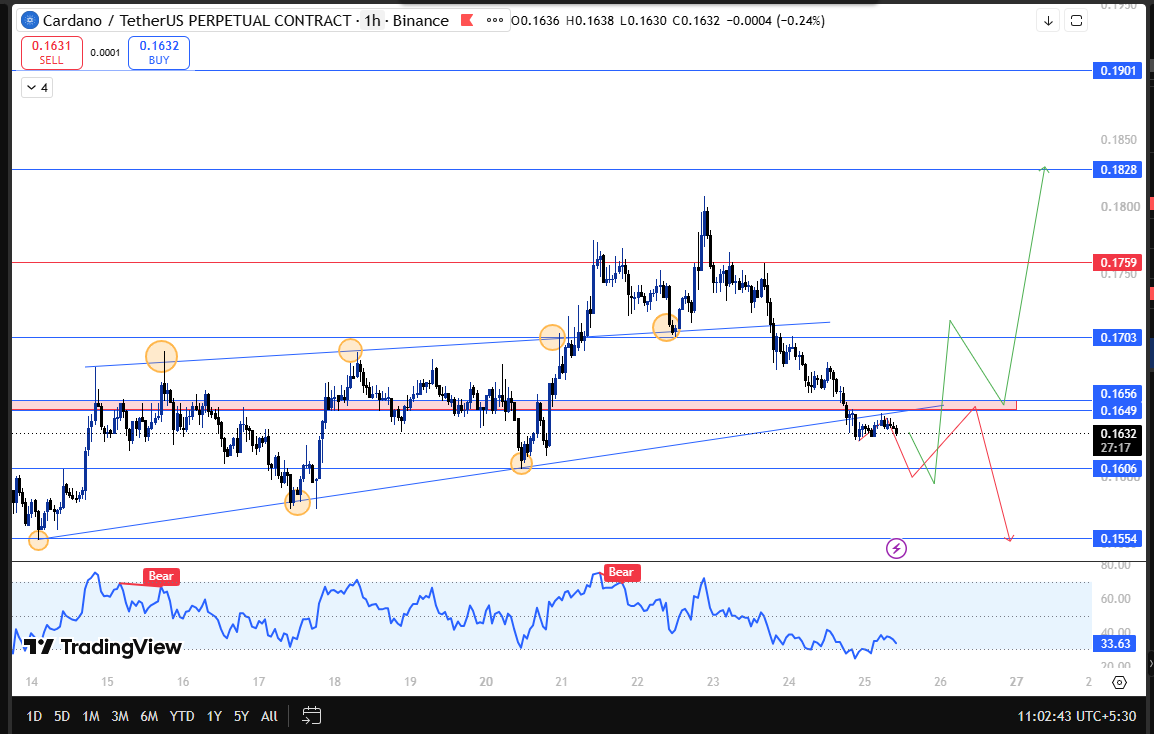
Price then pulled back to retest the broken wedge line before pushing higher again on a second breakout attempt, a sequence covered in ourADA retest before rally analysis.
From there, bullish momentum weakened rapidly. Instead of extending the rally, price broke straight through the low of the rising channel that had carried it up, and that break is what triggered the current slide.
ADA is now trading below the $0.1649 to $0.1656 flip zone , a structure similar to what played out in our ADA broadening wedge flip zone breakdown.
A confirmed 1-hour close below $0.1606 invalidates the bullish recovery scenario and opens the door to $0.1554 as the next support.
On the other side, if ADA reclaims the flip zone and closes a 1-hour candle inside the $0.1649 to $0.1656 range, that would flip the bias back bullish, with resistance building at $0.1703, then $0.1759, $0.1828, and $0.1901 further out.
Cardano Technical Snapshot
Indicator
Signal
Trend
Confirmed wedge breakout followed by a successful retest before losing channel support.
Structure
Price trading below the flip zone and below the rising wedge
Liquidations
Longs dominate all four windows except the fairly even 12h split
Key Trigger
1h close below $0.1606 invalidates, 1h close in $0.1649-$0.1656 flips bullish
Broader Catalyst
CME futures' six-month mark in August ties into spot ETF eligibility
For a closer look at how this channel gave way, ourdescending channel break coverage walks through a comparable breakdown pattern.
Cardano Support And Resistance Levels To Watch
Type
Level
Note
Resistance 4
$0.1901
Extended upside target
Resistance 3
$0.1828
Next hurdle above $0.1759
Resistance 2
$0.1759
Mid-target on flip zone reclaim
Resistance 1
$0.1703
The first target if flip zone is reclaimed
Flip Zone
$0.1649 to $0.1656
Needs a 1h close inside this range to turn bullish
Current Price
$0.1632
Trading below the flip zone
Support 1
$0.1606
Invalidation trigger on a confirmed close below
Support 2
$0.1554
Next support if $0.1606 breaks
Risk-Reward Table
Case
Trigger
Target
Bull Case
1h close above $0.1649 to $0.1656
Move toward $0.1703, then $0.1759, $0.1828, $0.1901
Bear Case
1h close below $0.1606
Slide toward $0.1554
Invalidation Level
The bearish read on ADA stays intact as long as price holds below the $0.1649 to $0.1656 flip zone on a closing basis.
A confirmed 1-hour close below $0.1606 invalidates the bullish recovery scenario. and shifts focus to $0.1554. On the other hand, a wick back above the flip zone followed by a 1-hour close inside $0.1649 to $0.1656 would be treated as a reclaim, opening the path toward $0.1703 and beyond.
This mirrors the logic covered in ourADA breakout analysis, where a similar flip zone reclaim determined the next leg.
Cardano Glossary
Rising Wedge: A chart pattern formed by two converging upward-sloping trendlines, often resolving with a breakout in either direction after a retest.Flip Zone: A price band that has previously acted as resistance before turning into support, or vice versa. Rising Channel: A price structure moving higher between two parallel trendlines, with the lower line acting as dynamic support until it breaks.Liquidation: What happens when a leveraged trade gets forcibly closed because the trader ran out of margin to keep it open.CME Futures: Regulated futures contracts traded on the Chicago Mercantile Exchange, often used as a benchmark for institutional access to an asset.
RSI Analysis: The 14-period RSI is hovering near 34, indicating bearish momentum while approaching oversold territory. Although this does not guarantee a reversal, it suggests downside momentum may begin slowing if buyers return near support.
CoinGabbar's Technical Analyst View
The break of the rising channel low right after a confirmed wedge breakout and retest is the key detail on this ADA chart, since it shows the recovery lost momentum exactly at the lower boundary of the recovery channel.
Price trading below both the flip zone and the trendline puts the near-term bias on the bearish side unless $0.1649 to $0.1656 gets reclaimed on a closing basis.
A confirmed close below $0.1606 would confirm the breakdown and open $0.1554 as the next stop. Longer term, the CME futures milestone in August and the pending Grayscale ETF application remain factors that could shift sentiment regardless of how this short-term structure resolves.
Disclaimer
This Cardano price prediction is based on technical chart analysis and market data available at the time of writing. Cryptocurrency markets are highly volatile, and prices can change rapidly. This content is for informational purposes only and should not be considered financial advice. Always do your own research and consult a qualified financial advisor before making any investment decisions.