Analyst warns that a daily close below Cardano’s $0.21 channel support could trigger further losses toward $0.17. ADA whale holdings have remained largely unchanged for 10 days, offering no c
- Analyst warns that a daily close below Cardano’s $0.21 channel support could trigger further losses toward $0.17.
- ADA whale holdings have remained largely unchanged for 10 days, offering no clear directional signal as bearish momentum strengthens.
- Cardano faces immediate support at 0.215–0.220 and resistance at $0.233, with $0.241 marking a stronger recovery hurdle.
Cardano (ADA) faces renewed downside risk after analyst Ali Charts identified a bearish SuperTrend signal and warned of a potential breakdown below $0.21. His October 21 analysis highlighted limited changes in large investor holdings, while ADA traded near $0.225. A daily close below $0.21 could expose the token to $0.17.
Ali Charts Identifies Bearish Signals and Whale Activity
Ali Charts said wallets holding between 100 million and 1 billion ADA have historically coincided with major price movements when their holdings change. However, these large investors’ balances have remained relatively flat over the past 10 days, showing no clear directional bias.
Meanwhile, Cardano’s SuperTrend indicator has turned bearish. Ali noted that a comparable signal appeared May 22 before ADA recorded a 46% correction. However, he cautioned that the earlier decline does not guarantee a repeat.
https://twitter.com/alicharts/status/2112523860675625381?s=20
Ali identified $0.21 as the lower boundary of Cardano’s rising price channel. A daily close below that level would confirm a breakdown in his analysis, potentially opening the way toward $0.17. He is watching both this support and possible reductions in whale holdings for confirmation.
ADA Chart Shows Pressure Below Key Moving Averages
The October 21 chart places ADA near $0.225, down from an early-October peak around $0.28. The price history from April through October shows a decline into June, a recovery through August, and a September rally followed by a reversal.
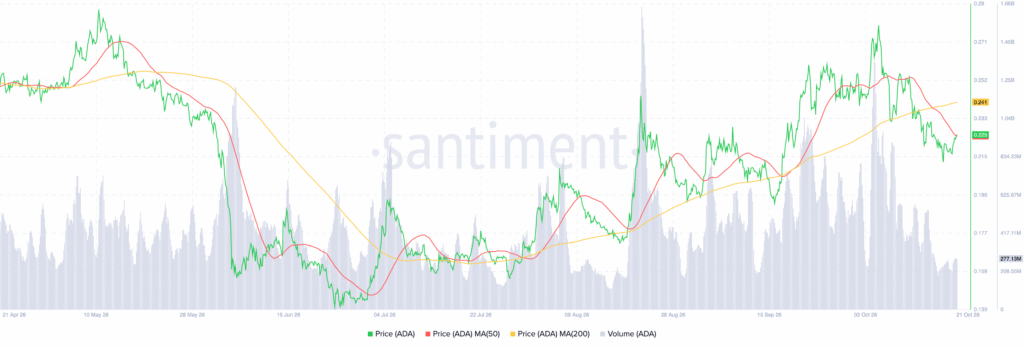
Source: Santiment
Immediate support lies between $0.215 and $0.220. If that zone fails, the chart identifies $0.196 and $0.177 as lower price levels. Resistance stands near $0.233, followed by the 200-day moving average around $0.241.
ADA Momentum Weakens as Support Comes Into Focus
The 50-day moving average sits near $0.225 and has turned downward since the October peak. ADA is trading around or slightly below that average, while the 200-day average remains above the current price.
Trading volume increased during the September-October rally and subsequent reversal. However, recent volume appears lower than during those larger moves. Holding 0.215–0.220 could support consolidation toward $0.233, while a sustained move above $0.241 would provide stronger evidence of recovery.